

Talking Points:
- GBP/USD faces strong resistance just below 1.36
- With a light economic calendar this week, focus will be on NF data out on Friday

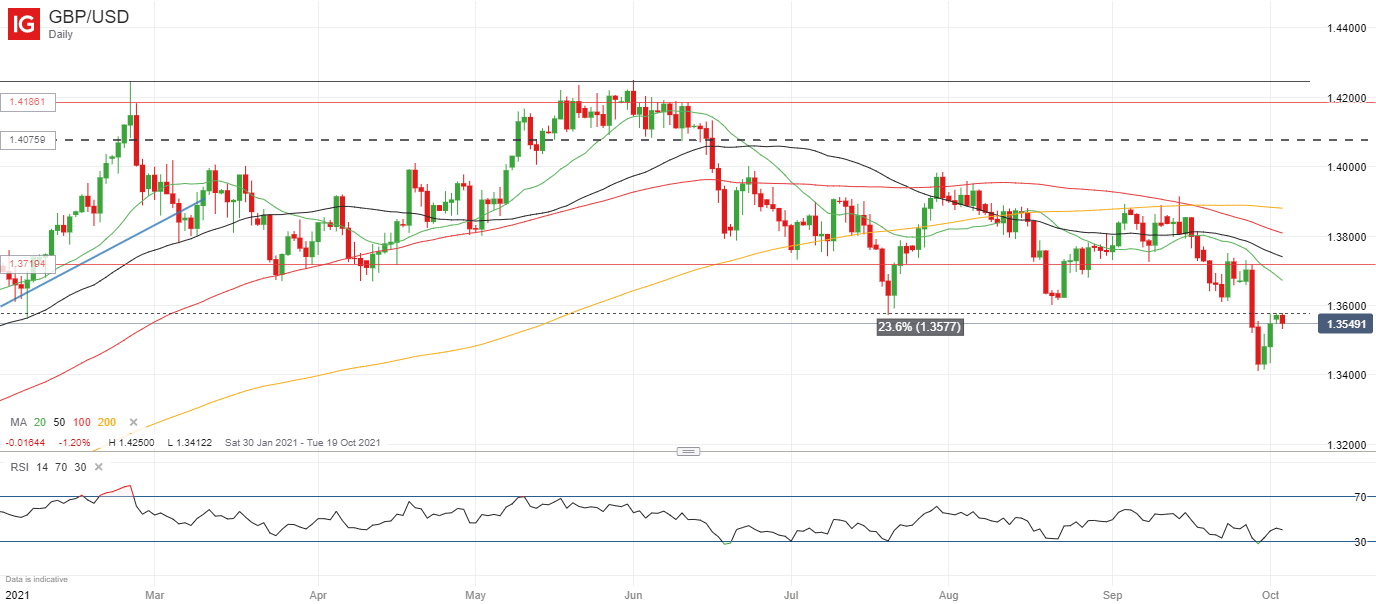
GBP/USD is struggling to break above a key Fibonacci level despite continued support from buyers. The pair has managed to stage a good comeback since last Thursday as the US Dollar has come off slightly from its impressive rally last week but there isn’t a clear path higher as resistance looms close by.
The area between the 23.6% Fibonacci retracement (1.3577) from the February 2021 highs and the 1.36 mark is the key challenge up ahead and with a lack of data on the calendar for today’s session and a pretty quiet start to the week in markets we could expect GBP/USD to remain around current levels throughout the day, with possible sideways consolidation in the coming sessions. Last week’s bounce does seem to have gotten a bit ahead of itself and with the pair trading below its key moving averages, the short-term buying momentum seems to be pressured.
GBP/USD Daily Chart
The calendar is pretty weak for the UK this week with only some PMI data coming out over the next few days. The focus will be on the jobs data for the US on Friday, which has had a lot of emphases put on it as the Fed has signaled that a strong reading would likely lead to the start of monetary tightening in its November FOMC meeting. The data will also draw a lot of attention as fears of stagflation have started to mount, with a strong jobs reading likely pushing back those fears about growth stagnating anytime soon.
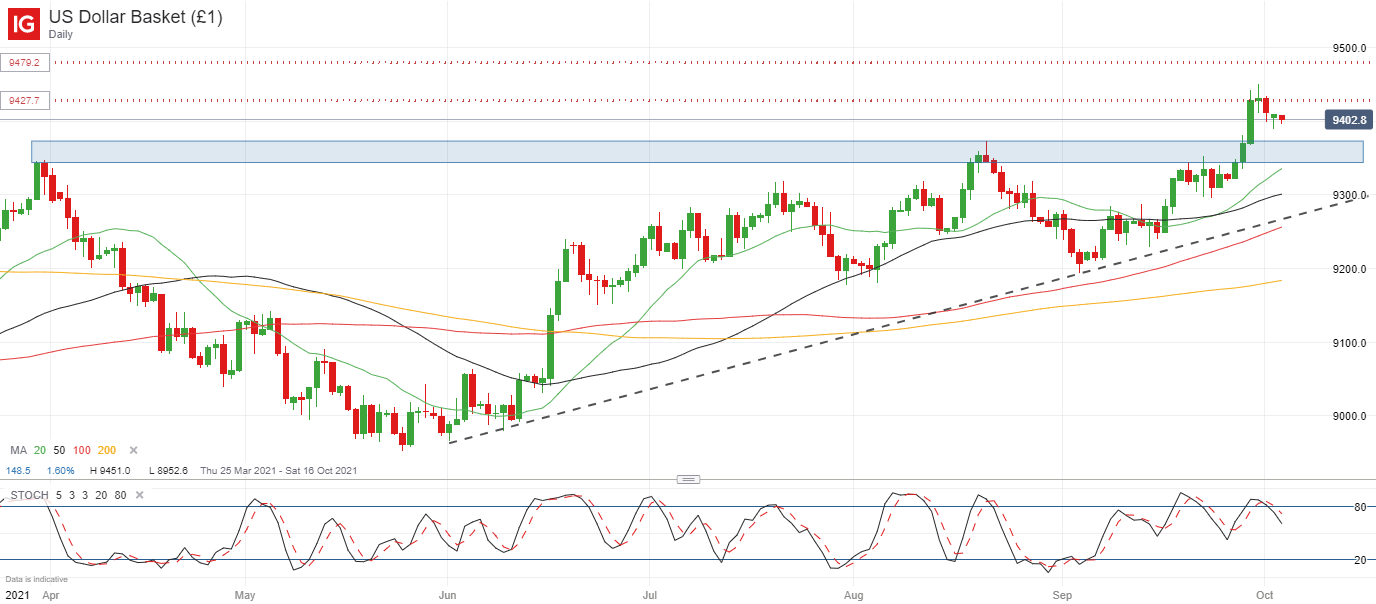
On the Dollar side, the DXY has been rejected within the resistance area (94.27 – 94.79) I mentioned last week. These are the September and October 2020 highs, and both of them were followed by strong pullbacks so an increase in bearish pressure was expected. The question now is whether Dollar bulls are going to be able to hold the DXY above 94 over the coming days as the last two daily candlesticks show attempted bearish reversals but strong support so far around 93.90 with Sunday’s opening candlestick showing a hammer pattern, which may be the indicating a short-term bottom.
DXY Daily Chart

Learn more about the stock market basics here or download our free trading guides.
--- Written by Daniela Sabin Hathorn, Market Analyst
Follow Daniela on Twitter @HathornSabin