


USD/CAD Price, Chart, and Analysis
- USD/CAD testing short-term moving average support.
- Traders have cut their long exposure over the week.
Keep up to date with all market-moving data releases and events by using the DailyFX Calendar
Dow Jones Resilient After FOMC Rate Decision, Updated Rate Projections
The latest FOMC rate decision (see link above) and subsequent press conference suggested that the Fed will announce a bond tapering timetable at the November meeting, while moves in the Fed’s dot plot also suggested a rate hike in 2022 may be on the cards. The mildly hawkish outtake from yesterday’s meeting is not being felt by the US dollar today with the DXY slipping lower after rallying for the last couple of weeks. It may be that the greenback got ahead of itself going into the FOMC meeting and today’s drift lower is just balancing out the recent bullish price action.

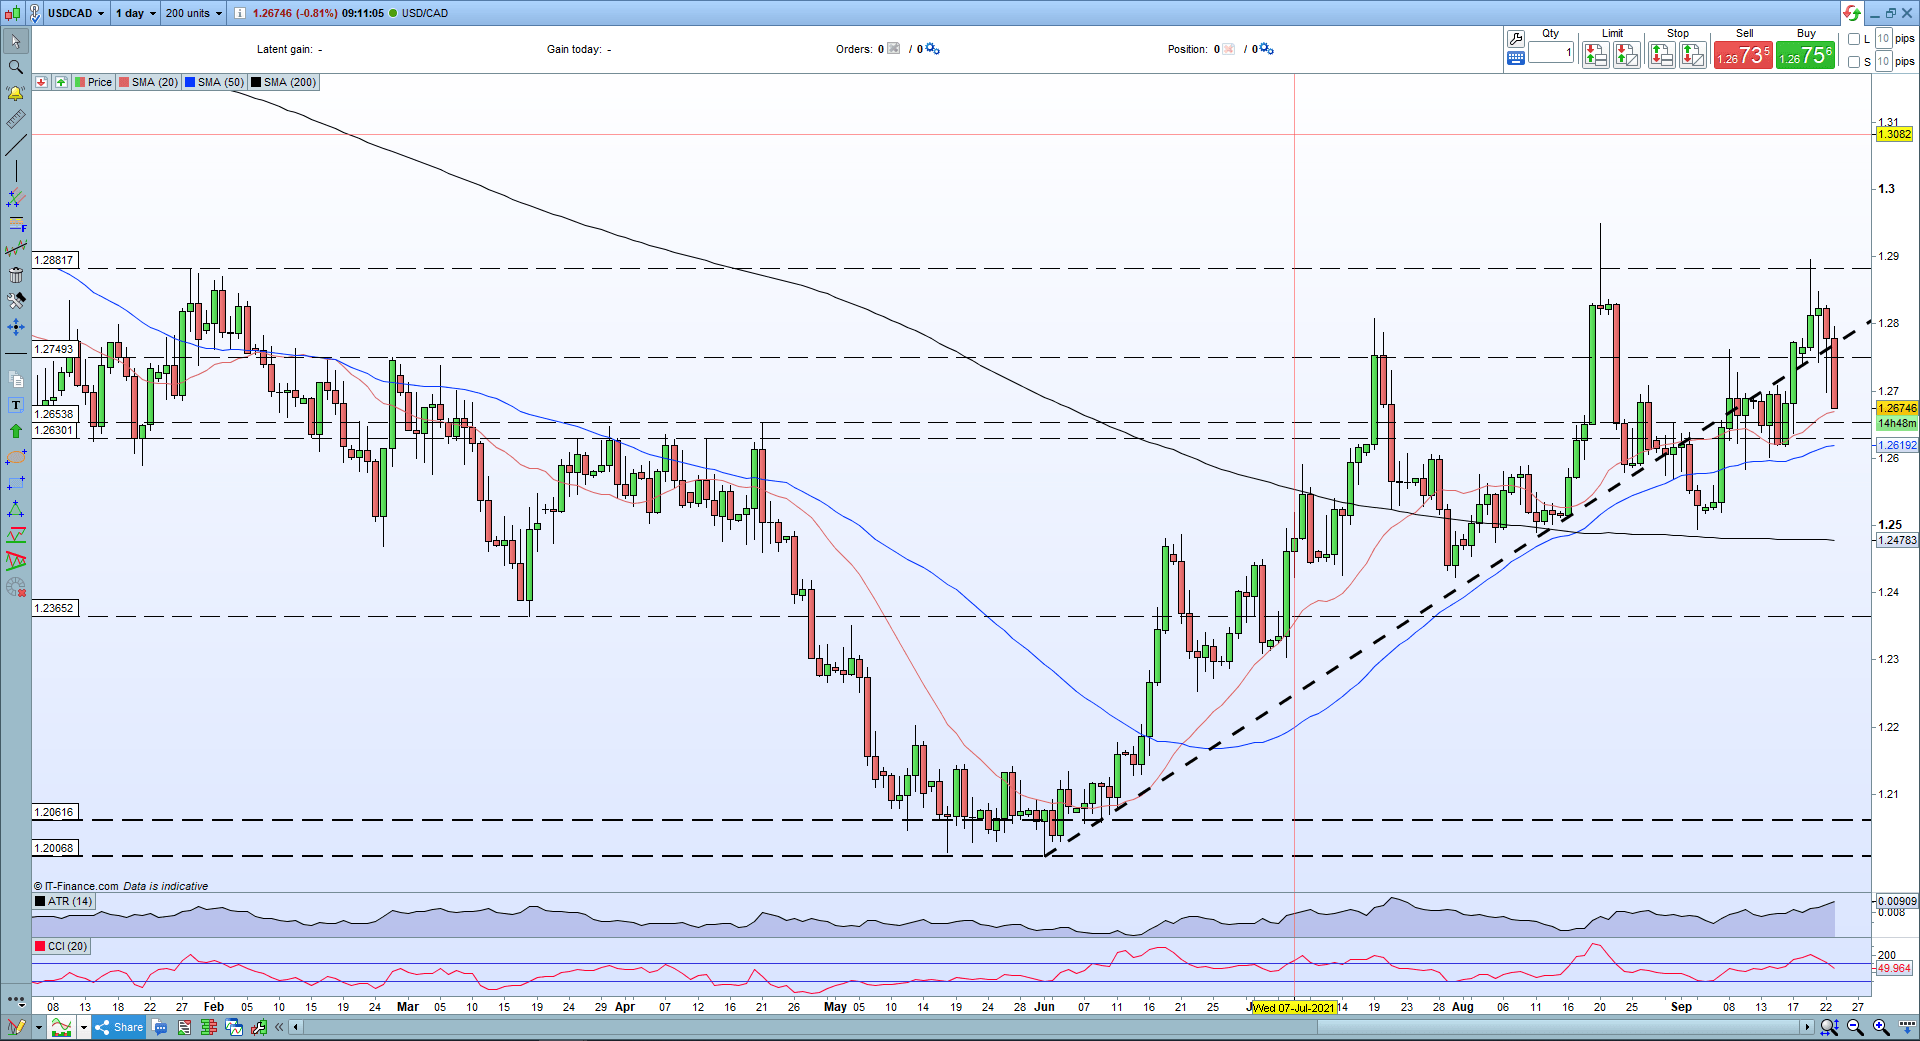
USD/CAD has been a volatile pair of late with the ATR hitting multi-week highs. This volatility is a combination of pre-FOMC US dollar price action and the recent swings seen in the oil market with Brent crude jumping around $10 a barrel in the last month. Both Brent and US crude are close to or touching, multi-week highs.
Moving Averages (MA) Explained for Traders
The recently supportive USD/CAD trendline has once again turned into resistance. The pair are now testing the 20-day simple moving average, an indicator that has held for the last two weeks. The 50-day sma sits just 40 pips lower and should provide a secondary layer of support, having held for the last three months. Today’s sell-off may well reverse in the short-term but if oil remains bid then USD/CAD may continue to fade lower over the shorter- to medium-term.
USD/CAD Daily Price Chart September 23, 2021
Retail trader data show 54.07% of traders are net-long with the ratio of traders long to short at 1.18 to 1. The number of traders net-long is 11.29% higher than yesterday and 30.41% lower from last week, while the number of traders net-short is 16.16% lower than yesterday and 35.51% higher from last week.
We typically take a contrarian view to crowd sentiment, and the fact traders are net-long suggests USD/CAD prices may continue to fall.Positioning is more net-long than yesterday but less net-long from last week. The combination of current sentiment and recent changes gives us a further mixed USD/CAD trading bias.
| Change in | Longs | Shorts | OI |
| Daily | -10% | -2% | -5% |
| Weekly | 22% | -8% | 0% |
What is your view on USD/CAD – bullish or bearish?? You can let us know via the form at the end of this piece or you can contact the author via Twitter @nickcawley1.


