


Key Talking Points:
- XAU/USD unable to find momentum above 1,800
- US CPI dip should have benefitted gold prices

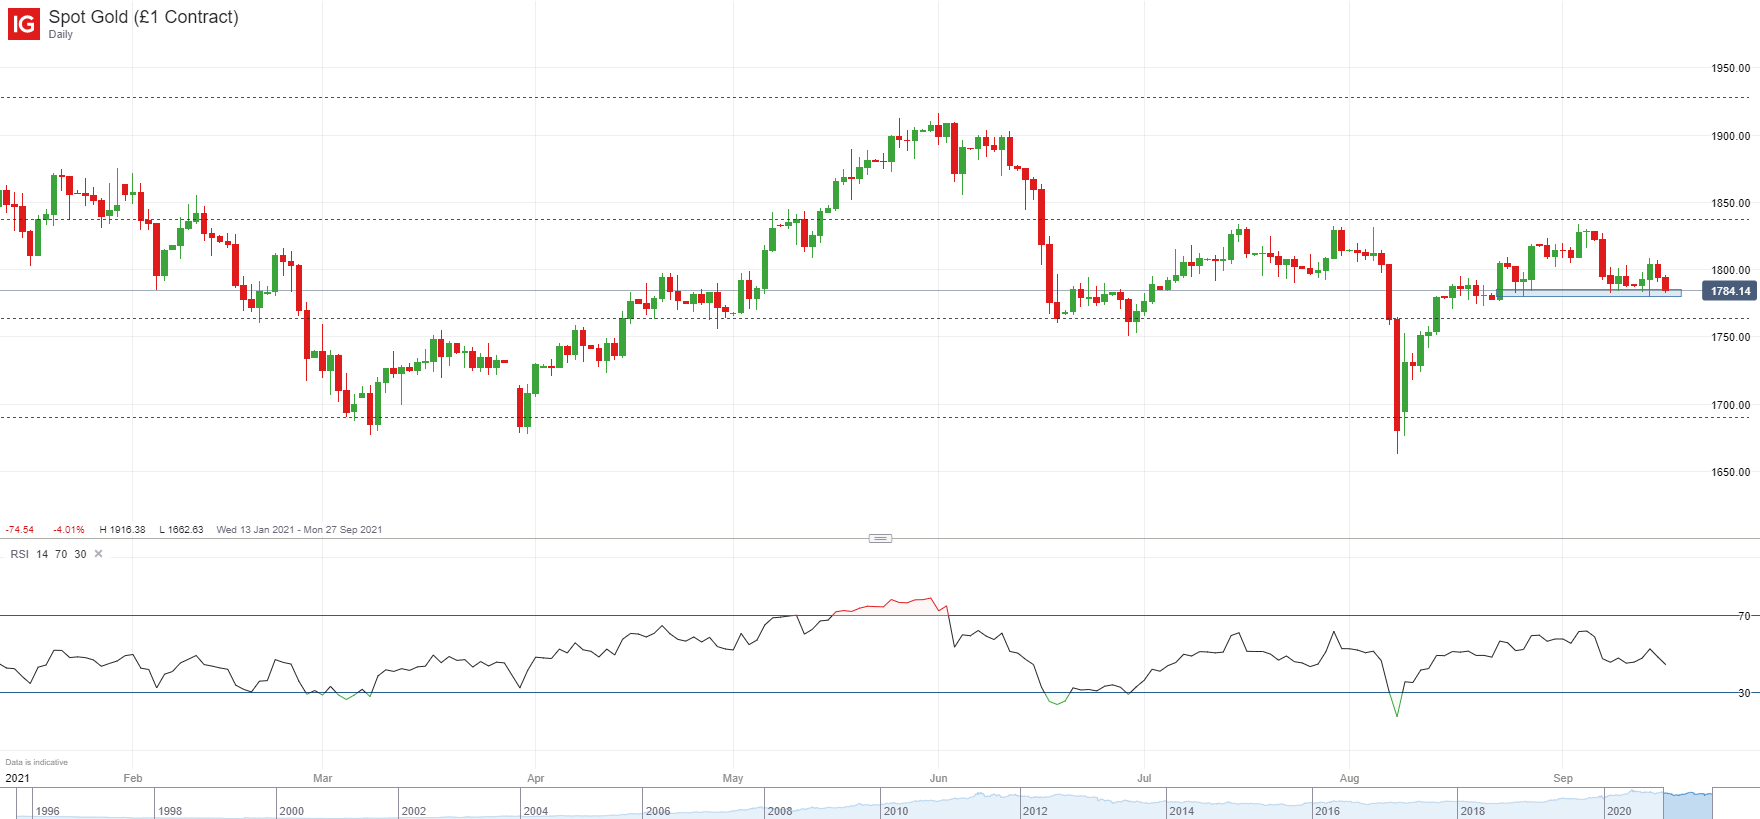
Gold (XAU/USD) continues to pull back after another rejection at the 38.2% Fibonacci retracement (1,836). The precious metal is finding some support around recent lows (1,785/80) but momentum seems to be building for another break lower. I do see support arising up until 1,771 at which point Gold is at risk of falling below 1,750 for the fourth time this year. Alternatively, a break above 1,808 would be a good sign that buyers are picking up momentum for a new attempt to break above the Fibonacci resistance.
XAU/USD Daily chart
The August reading for US CPI has suggested that inflation may have well peaked, which falls in nicely with Powell’s transitory argument. This would in theory be a driver for Gold as it scales back the need for the Fed to start tapering soon, possibly leaving rates lower for longer, which is positive for the non-yielding yellow metal. But investor positioning suggests that expectations are still high that the Fed will announce a start to tapering at its September meeting next week, which would be a headwind for XAU/USD, and likely a cause for the renewed pullback.
But even with the delta variant and a global economic slowdown posing risks for the markets gold has been unable to capitalise on bullish momentum. In fact, even with the Dollar flat and skewed to the downside over the past few weeks, which is usually a positive for gold, the precious metal has been unable to break above its Fibonacci resistance. This does raise even more doubts about gold’s ability to recover the bullish momentum seen last year if it is unable to take advantage of market conditions that play in its favor.
XAU/USD Monthly chart

The move in gold on the monthly chart has worsened since I last looked at it 9 days ago. It has, however, kept within the 38.2% and 50% Fibonacci levels as I had predicted. The RSI is flattening towards the mid-point which would suggest a lack of immediate direction, possibly keeping XAU/USD flat within these two key levels I just mentioned.
Fibonacci Confluence on FX Pairs
Learn more about the stock market basics here or download our free trading guides.
Traders of all levels and abilities will find something to help them make more informed decisions in the new and improved DailyFX Trading Education Centre
--- Written by Daniela Sabin Hathorn, Market Analyst
Follow Daniela on Twitter @HathornSabin


