GBP price, news and analysis:
- GBP/USD continues to ease back, partly on flows into the safe-haven US Dollar as concerns mount about the global economic recovery and possible reductions in monetary stimulus worldwide, weakening sentiment.
- In addition, though, the UK Government’s tightening of fiscal policy this week might persuade the Bank of England to keep monetary policy looser than would otherwise have been the case.
- Together then, after falls every day so far this week, GBP/USD could well slip back further.
GBP/USD may fall further
GBP/USD is under downward pressure from both a firmer US Dollar and a weaker British Pound so looks set to continue the slide seen every day so far this week although, as ever, there could be a pause for breath first.
On one side, the safe-haven USD continues to benefit from broadly risk-off sentiment in the markets as concern grows about the spread of the Covid-19 delta variant in the US and the possibility of Federal Reserve tapering of its monetary stimulus measures.
On the other, Prime Minister Boris Johnson has secured the backing of UK Members of Parliament for his £12 billion tax increase to help the National Health Service and the social care sector. While this fiscal tightening will have only a marginal impact on when the Bank of England will tighten monetary policy, it might at least push that monetary tightening further into the future.
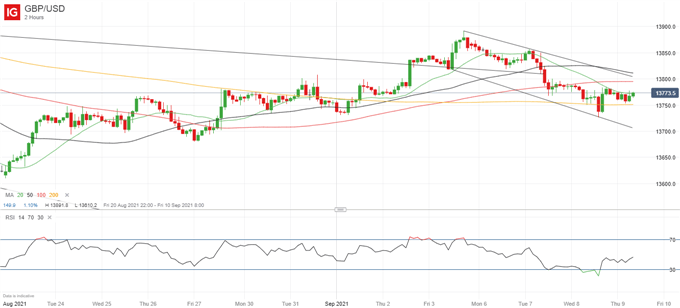
GBP/USD Price Chart, Two-Hour Timeframe (August 23 – September 9, 2021)

Source: IG (You can click on it for a larger image)
As for the technicals, as the chart above shows, GBP/USD has been slipping back since reaching a high at 1.3892 on September 3. It now lies roughly in the middle of a downward-sloping channel in place since then, with potential to reach the channel support line currently around 1.37.
Note too that the Relative Strength Index at the bottom of the chart is not yet indicating an oversold market.
Turning to sentiment, IG client positioning data are also sending out a bearish signal. These retail trader figures show 58.38% of traders are net-long, with the ratio of traders long to short at 1.40 to 1. The number of traders net-long is 2.11% higher than yesterday and 1.92% higher from last week, while the number of traders net-short is 7.21% lower than yesterday and 4.27% lower from last week.
At DailyFX, we typically take a contrarian view to crowd sentiment, and the fact traders are net-long suggests GBP/USD prices may continue to fall. Moreover, traders are further net-long than yesterday and last week, and the combination of current sentiment and recent changes gives us a stronger GBP/USD-bearish contrarian trading bias.


--- Written by Martin Essex, Analyst
Feel free to contact me on Twitter @MartinSEssex


