


Key Talking Points:

So after all that wait, the August NFP day is finally here. Traders have likely had this date marked in the calendar for several weeks now as the path of asset tapering is largely dependent on a strong jobs market, given that inflation had hit its target a few months ago.
After what looked like a strong start to the year, new payrolls fell well below expectations in April and May as the latest wave of the pandemic was hitting hard, and so analysts were left wondering when the Fed would start to consider reducing its net asset purchases given rising inflation concerns. And just as the summer got underway we got some comments from Fed members confirming that the timeline for tapering would be dependent on the jobs market, and so the NFP became the figure to watch for every month.
The data has been on a solid path since June so far, and that’s why a lot is riding on today’s figure, as a strong reding would likely mean asset tapering would start before year-end, rather than early 2022, allowing for a greater gap in time before interest rate hikes are considered.
But the latest ADP figure has caused some concern about the reading later today despite it having little predictive power over the NFP reading. But it does allow for markets to gauge investor positioning prior to the release, and given yesterday’s selloff in the US Dollar, expectations are pretty bearish going into the announcement, and so a figure above 700K is likely to be USD positive.
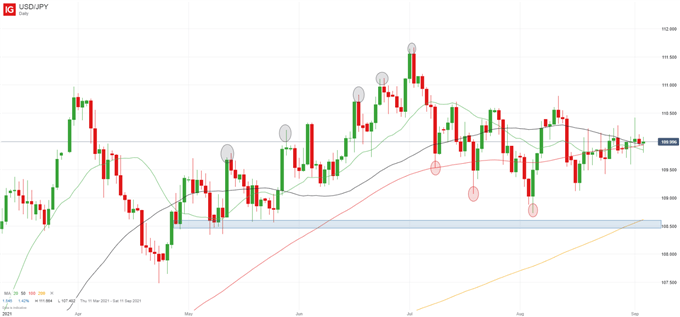
USD/JPY: the pair has been playing nicely into the symmetrical pattern I pointed out last week although I do admit I would have liked to see a clearer direction by now. I was hoping for a break above 110.5 to then reverse towards 108.50 by this week, but the pair seems to be taking longer than previously to consolidate the pattern. A stronger Dollar later today may see the rise to 110.50 happen by close of business and, therefore, set up the scene nicely for a reversal early next week, but so far USD/JPY seems to be anchored around the 110.00 mark, which is roughly where it was last time I wrote about it last Thursday.
USD/JPY Daily Chart
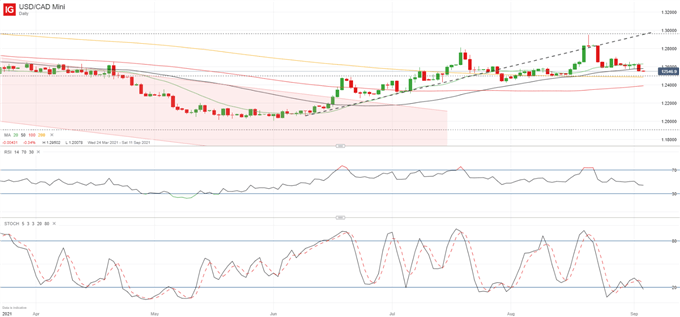
USD/CAD: the pair hasn’t been able to garner much momentum since it came back down to the 1.26 mark after the attempted breakout on the 19th of August and yesterday’s pullback seems slightly overextended going into today’s session. There is a key support close by (127.2% Fib at 1.2496) where the 200-day SMA is converging, followed by the 1.24 mark where the 100-day SMA is converging and so I expect sellers to have a tough time breaking below this area. On the upside, both the RSI and the stochastic are showing plenty of room for a push higher but the pair will need to hold above 1.2660 before further bullish momentum may be considered.
USD/CAD Daily Chart
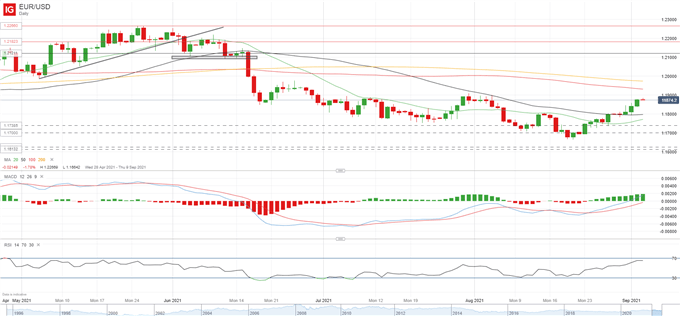
EUR/USD: the pair has staged an impressive rebound over the last two weeks and is now back above 1.1875 for the first time since the beginning of August. The aim for buyers will be to break above 1.19 but the bullish run does seem slightly overextended at this point and so I wouldn’t be surprised if that level acts as more of a barrier in the short term. A pullback is likely to bring the pair back towards the 1.18 mark at which point the 50-day SMA is likely to offer some short-term support.
EUR/USD Daily Chart

Learn more about the stock market basics here or download our free trading guides.
--- Written by Daniela Sabin Hathorn, Market Analyst
Follow Daniela on Twitter @HathornSabin


