


RAND ANALYSIS
- SA and U.S. economic data favors rand.
- Non-Farm Payroll (NFP) in focus.
- USD/ZAR testing key support levels – potential reversal?
ZAR FUNDAMENTAL BACKDROP
The South African rand has had an incredible last two weeks as the local currency rallied roughly 6.5% against the U.S. dollar. This brings the rand to a familiar spot on the year-to-date (YTD) rankings against the greenback (see graphic below).
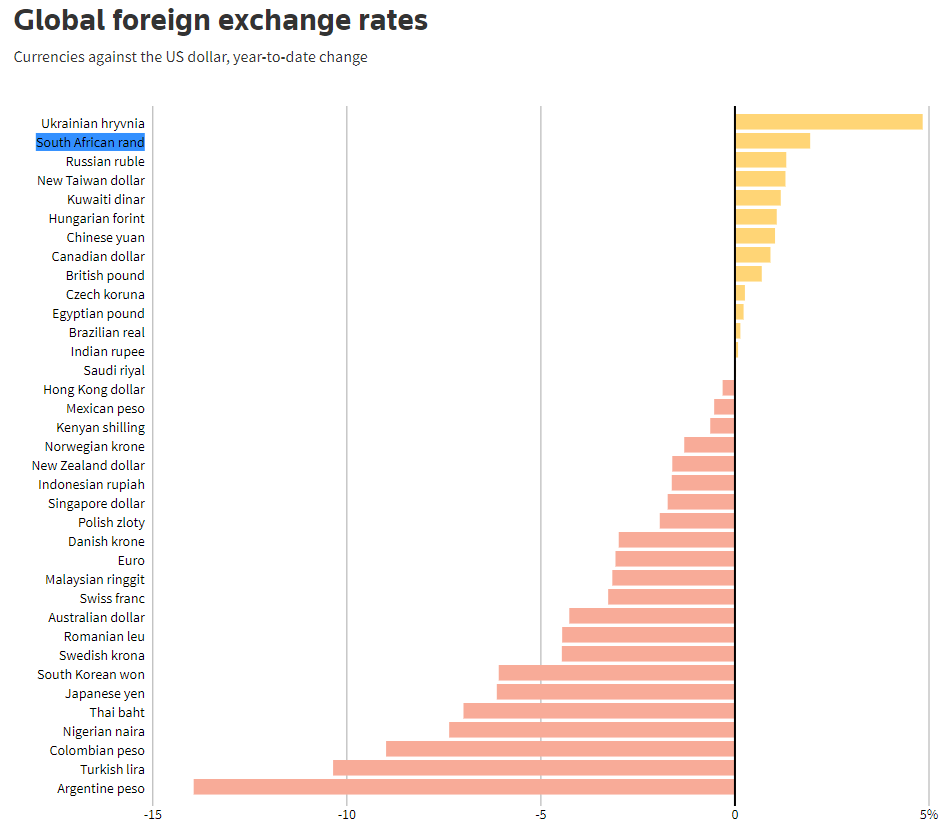
Source: Reuters
GET YOUR Q3 RAND FORECAST HERE!
There has been a broad-based uptick in Emerging Market (EM) currencies primarily due to dollar weakness as rand linked commodities (gold, platinum and iron ore) have been relatively subdued during the same period. This comes after the dovish slant given by Fed Chair Jerome Powell at the recent Jackson Hole Symposium along with unsupportive economic data such as yesterdays ADP and uninspiring PMI prints (see calendar below). South African PMI data significantly improved on previous figures with the measure coming in well above the 50 level which suggests an expanding manufacturing economy – the highest since October 2020.
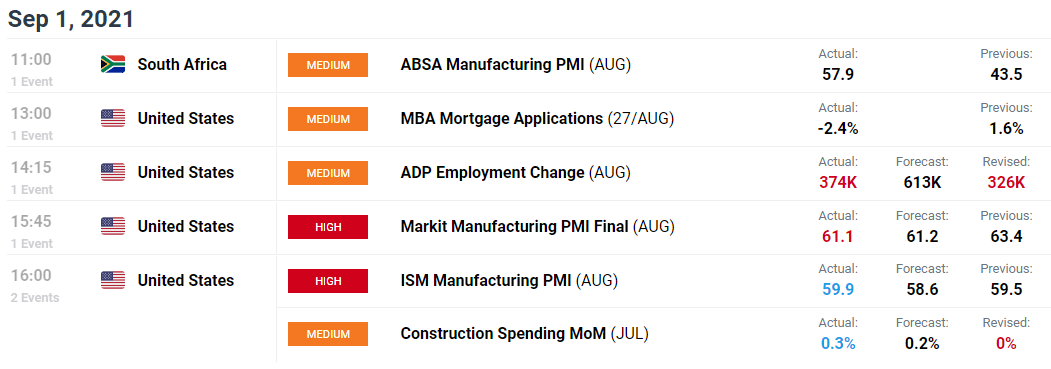
Source: DailyFX economic calendar

SPOTLIGHT ON NFP TOMORROW
All eyes firmly focus on tomorrows NFP and unemployment data which can possibly change the recent trajectory of rand strength should actual figures exceed estimates. Expect pre and post-announcement volatility on USD/ZAR.
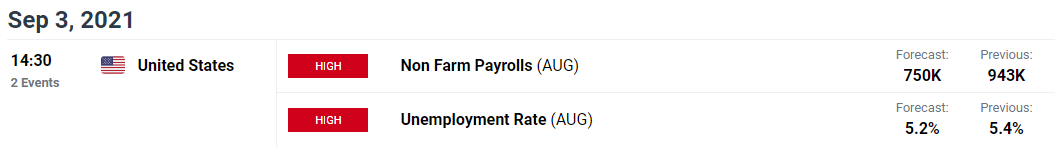
Source: DailyFX economic calendar
TECHNICAL ANALYSIS
USD/ZAR DAILY CHART
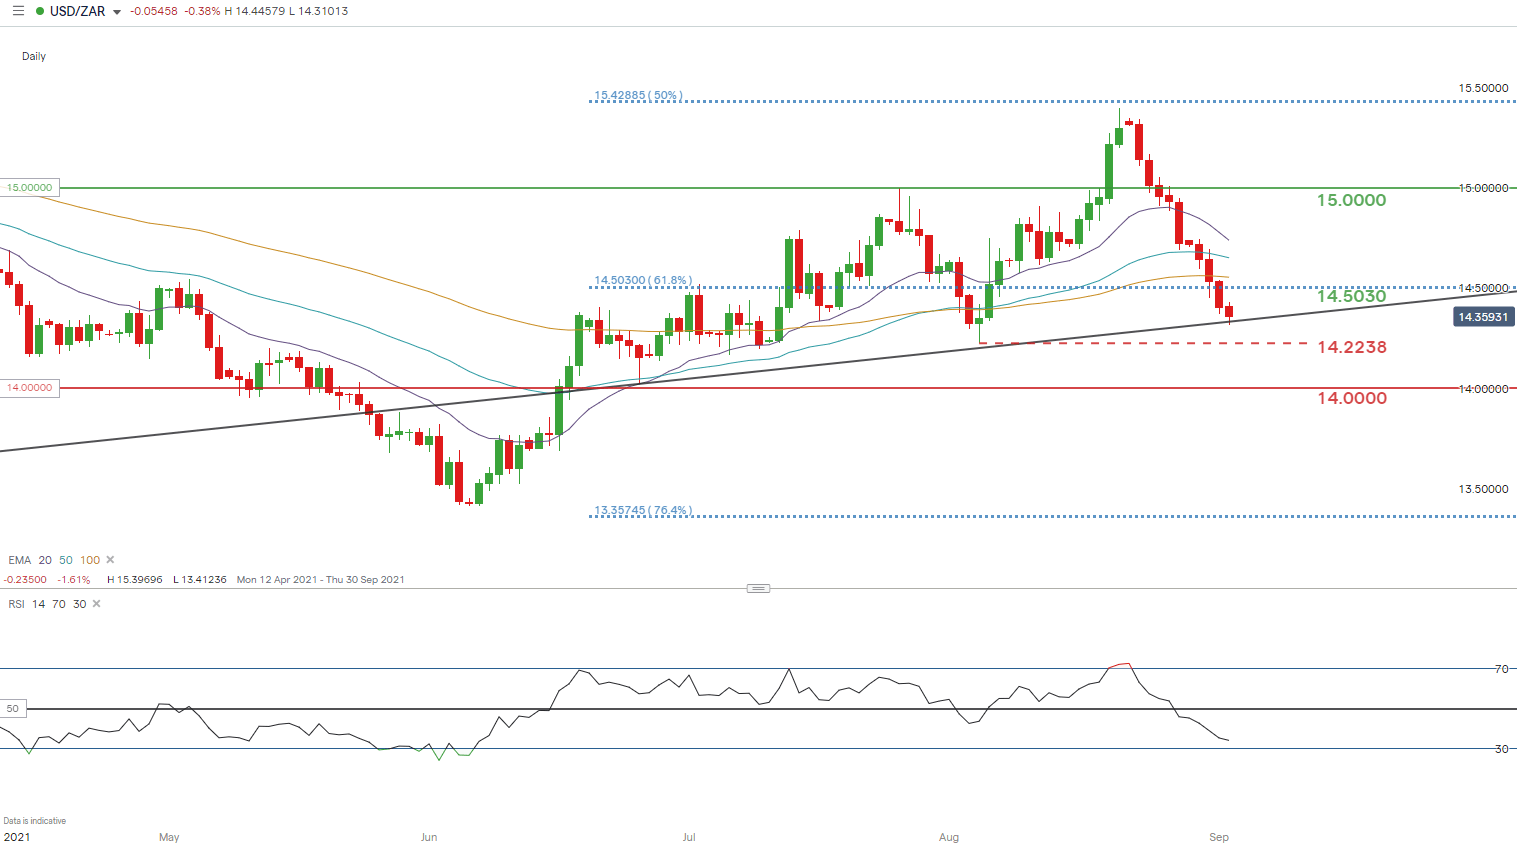
Chart prepared by Warren Venketas, IG
While markets keenly await the NFP report, the technicals reflect the potential for a bullish reversal on the pair. Price action reveals hesitancy around the recent trendline support (black). Prices have additionally deviated quite extensively from the EMA’s and currently sits relatively far from the 20-day EMA (purple). This could lead to a rebound from USD/ZAR bulls as the potential for mean reversion is high. The Relative Strength Index (RSI), further supports this notion with the oscillator approaching oversold levels. This does not take away from the fact that the pair is in a strong near-term downtrend, but I do not foresee rand strength for much longer.
Resistance levels:
- 100-day EMA
- 14.5030 – 61.8% Fibonacci level
Support levels:
- Trendline (black)
- 14.2238
- 14.0000
Trade Smarter - Sign up for the DailyFX Newsletter
Receive timely and compelling market commentary from the DailyFX team
--- Written by Warren Venketas for DailyFX.com
Contact and follow Warren on Twitter: @WVenketas


