


S&P 500, Nikkei 225, Real Estate Sector, ADP Employment Report, Technical Analysis – Asia Pacific Indices Briefing
- S&P 500 ends relatively flat, supported by gains in the real estate sector
- Soft ADP employment report underscored dovish Fed view on labor data
- Nikkei 225 eyes Descending Triangle after closing at highest since mid-July
Trade Smarter - Sign up for the DailyFX Newsletter
Receive timely and compelling market commentary from the DailyFX team
Wednesday’s Wall Street Trading Session Recap
Stocks ended a mixed session on Wall Street as Wednesday wrapped up. The S&P 500 was flat, rising 0.03%. Meanwhile, the tech-heavy Nasdaq Composite gained 0.52%. Cyclical stocks underperformed the broader market, with the Dow Jones Industrial Average weakening 0.14%. The fundamental forces at play here might have been the continuation of the post-Fed Jackson Hole symposium trade.
A softer-than-expected ADP employment report underscored Chair Jerome Powell’s dovish take on the labor market last week. Private payrolls only advanced by 374k in August, far undershooting the 625k consensus. This comes ahead of non-farm payrolls data on Friday. In other words, the markets likely found more reasoning to believe that the Fed may hesitate from raising rates soon after tapering quantitative easing.
The latter may be what is driving demand for tech stocks once again, which can be relatively more sensitive to changes in monetary policy expectations. The real estate sector also held up the S&P 500, handsomely outperforming other components of the index. This followed data from earlier this week that showed US housing prices continued their relentless journey higher at breathtaking paces across the country.
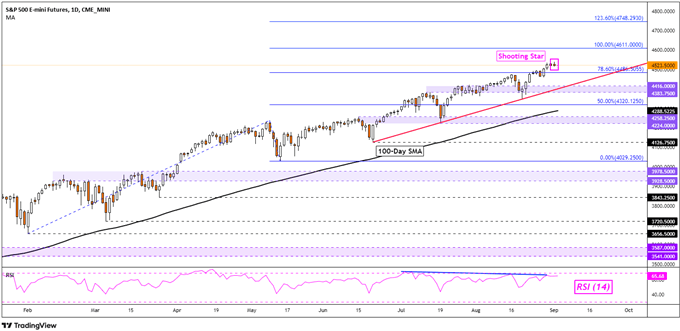
S&P 500 Technical Analysis
S&P 500 future have left behind a Shooting Star candlestick pattern on the daily chart below. This is a sign of indecision, which does not necessarily mean that a turn lower is in the cards. However, traders should watch for how the index performs in the coming days. Subsequent downside closes could hint that a material turn lower may be in the cards. In the meantime, rising support from June seems to be guiding the S&P higher.
Introduction to Technical Analysis
Candlestick Patterns
Recommended by Daniel Dubrovsky
S&P 500 Futures – Daily Chart
Thursday’s Asia Pacific Trading Session
Given the softer ADP employment report, Asia-Pacific indices may follow the mostly upbeat tone set by Wall Street. Traders may price in a softer non-farm payrolls report in the coming days, producing less-hawkish Fed policy expectations. That said, this may consequentially open the door to the markets overshooting a downward projection for NFPs.
This could create a ‘buy the rumor, sell the news’ situation for the jobs report. In the interim, the APAC economic docket is fairly quiet. Australia will release July’s trade balance report. There, the markets will see a closer look into how strict Covid lockdown policies impacted the external sector. Given the Reserve Bank of Australia’s cautious near-term outlook as it watches data unfold, the ASX 200 could see some volatility.
Trading Strategies and Risk Management
Global Macro
Recommended by Daniel Dubrovsky
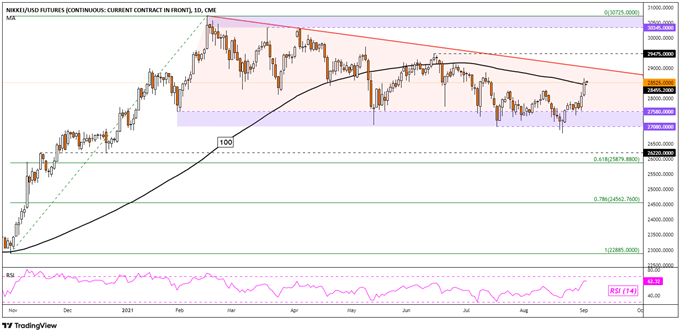
Nikkei 225 Technical Analysis
Nikkei 225 futures advanced to their highest since the middle of July over the past 24 hours. The index also closed above the 100-day Simple Moving Average (SMA). A confirmatory upside close above the line may open the door to extending gains. Still, the Nikkei 225 appears to be consolidating within the boundaries of a Descending Triangle. The direction of the breakout could have key implications for the dominant trend.
Nikkei 225 Futures – Daily Chart
--- Written by Daniel Dubrovsky, Strategist for DailyFX.com
To contact Daniel, use the comments section below or @ddubrovskyFX on Twitter


