


NASDAQ 100, NIKKEI 225, ASX 200 INDEX OUTLOOK:
- Dow Jones, S&P 500 and Nasdaq 100 indexes closed -0.54%, -0.58% and -0.59% respectively
- Fed Chair Jerome Powell will give a speech at Jackson Hole symposium at 10am ET on Friday
- Asia-Pacific markets are positioned to open lower following a negative lead

Jackson Hole, Fed Tapering, USD, Jobless Claims, Asia-Pacific at Open:
Wall Street equities pulled back from record levels on Thursday as investors mulled hawkish comments by St Louis Fed President James Bullard ahead of the Jackson Hole symposium. Bullard said on a TV show that he wants to see the central bank begin to scale back asset purchases to stave off inflation, and it may need to get “aggressive” if the tapering does not contain inflation.
Cyclically-oriented sectors such as energy (-1.51%), consumer discretionary (-0.73%) and materials (-0.68%) fell, pulling the S&P 500 index from all-time highs. PayPal(-1.47%),Tesla(-1.41%) and Facebook(-1.09%) were among the worst performing tech companies overnight.
Investors are eyeing Jerome Powell’s speech at the Jackson Hole symposium at 10am ET later today. His speech will be closely scrutinized for clues about the Fed’s tapering plan. Some market participants believe that the tapering program may be conducted in a slower-than-expected way, therefore it may not trigger a meaningful pull back in asset price.
Asia-Pacific markets may continue to trail behind their US peers due to lingering viral concerns and a widening crackdown on private sectors in mainland China. Chinese stocks listed in the US fell overnight, including Tencent (-1.53%), Alibaba (-2.28%) and Nio (-1.77%).
Nasdaq 100 Top 10 Stock Performance 26-08-2021
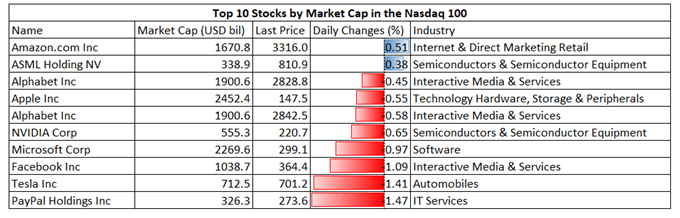
Source: Bloomberg, DailyFX
Meanwhile, weekly initial US jobless claims data came in line with expectations. Some 353k unemployment claims were filed last week, compared to a 350k estimate. The previous week’s figure was revised up slightly to 349k from 348k. The unemployment claims have been declining over the last few months, underscoring the resilience in the labor market against a viral resurgence.
US Weekly Jobless Claims
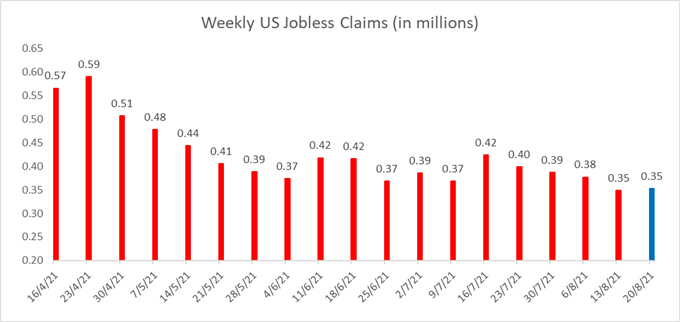
Source: Bloomberg, DailyFX
Asia-Pacific markets look set to open lower on Thursday. Futures in Japan, mainland China, Australia, Hong Kong, South Korea, Taiwan, Singapore, India and Thailand are all in the red, whereas those in Malaysia are in the green.
Nasdaq 100 Index Technical Analysis
The Nasdaq 100 index hit a key resistance level at 15,300 (the 127.2% Fibonacci extension) and has since pulled back. Breaching this level may open the door to further gains with an eye on 15,950. A pullback from here may bring prices to the 20-Day SMA line for immediate support. The bearish MACD indicator suggests that downward momentum may be building.
Nasdaq 100 Index – Daily Chart

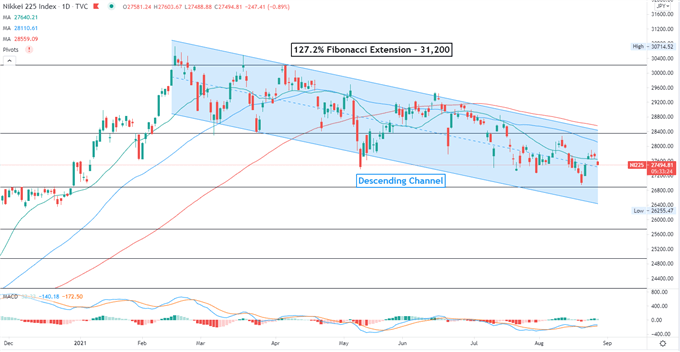
Nikkei 225 Index Technical Analysis:
The Nikkei 225 index remains in a “Descending Channel” formed since February. The floor and ceiling of the channel may be viewed as immediate support and resistance levels respectively. The overall trend remains bearish-biased, as suggested by the downward-sloped SMA lines. The MACD indicator is trending below the neutral line, suggesting that upward momentum may be weak.
Nikkei 225 Index – Daily Chart
ASX 200 Index Technical Analysis:
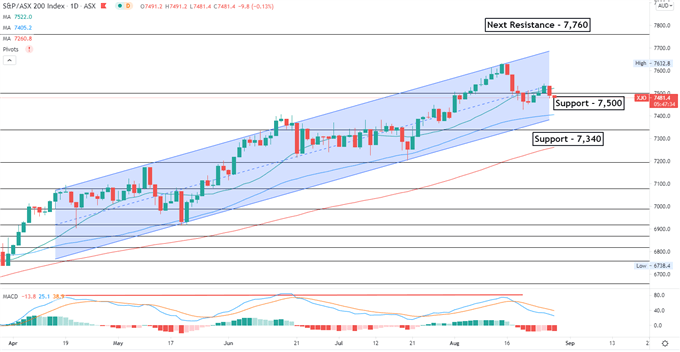
The ASX 200 index pulled back sharply to test an immediate support level at 7,500 – the previous resistance. The overall trend remains bullish-biased, as suggested by the consecutive higher highs and higher lows formed over the past few months. The MACD indicator formed a bearish crossover after hitting trendline resistance, suggesting that selling pressure may be prevailing.
ASX 200 Index – Daily Chart

--- Written by Margaret Yang, Strategist for DailyFX.com
To contact Margaret, use the Comments section below or @margaretyjy on Twitter


