


Gold (XAU/USD) Price, Chart, and Analysis
Trade Smarter - Sign up for the DailyFX Newsletter
Receive timely and compelling market commentary from the DailyFX team
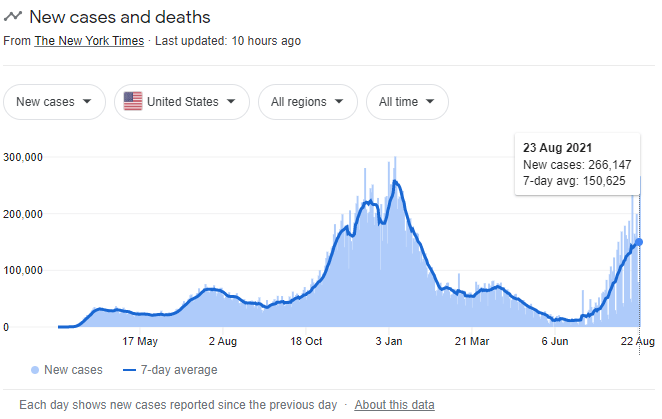
The surge of new US covid cases in recent is starting to temper expectations that Fed chair Jay Powell will announce a taper timetable at the, now virtual, Jackson Hole Symposium starting on Thursday. The latest data show that there were in excess of 266k new covid cases reported on Monday, an unwanted multi-month high.
Dallas Federal Reserve President Robert Kaplan, who said two weeks ago that the central bank should start tapering in September, changed his tune last week and said that the recent spread of the delta-variant is causing concern and that he may adjust his view on tapering if growth were to slow.
The US dollar has fallen sharply from multi-month highs, with Monday’s sell-off giving gold a boost higher. The greenback has been trading with tapering announcement priced-in for late this year, and the increasing spread of covid in the US is now draining some of that premium out of the dollar. While the technical set-up for DXY still favors higher prices, a further drift lower in the short-term cannot be discounted ahead of Fed chair Powell’s speech on Friday.
Keep up to date with all market-moving data releases and events by using the DailyFX Calendar
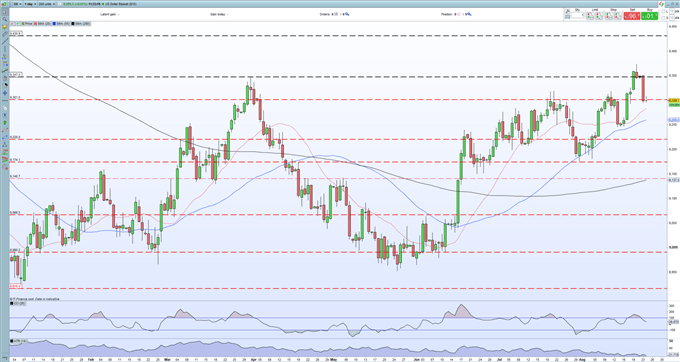
US Dollar Basket (DXY) Daily Price Chart (January - August 24, 2021)

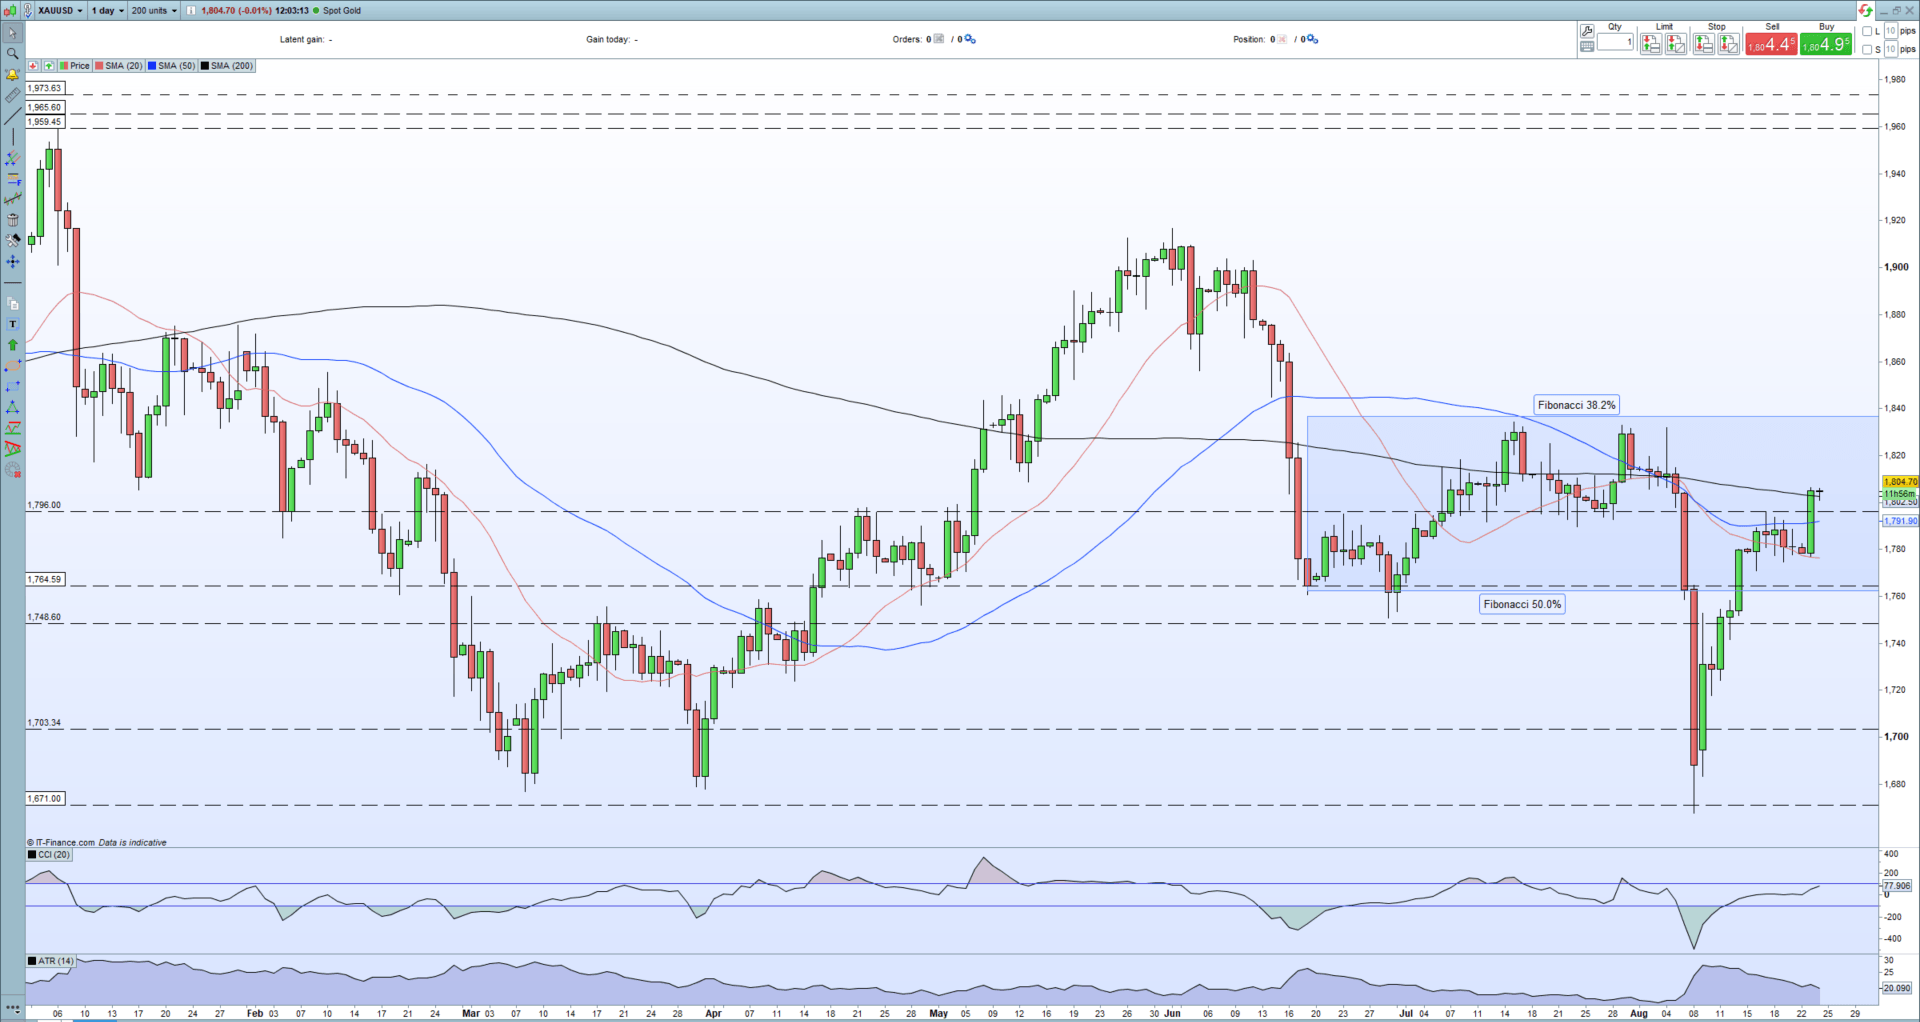
The precious metal is now in the middle of a familiar range, stuck between 38.2% Fibonacci resistance at $1,836/oz. and 50% Fibonacci support at $1,764/oz. Yesterday’s rally saw gold make a confirmed break of the 20-day sma and break through the 50-day sma, leaving the precious metal now trading either side of the 200-day sma. This positive move suggests that further gains may be seen unless the fundamental outlook – Jackson Hole Symposium – changes the outlook for the US dollar.
Gold (XAU/USD) Daily Price Chart (November 2020 – August 24, 2021)
Retail trader data show 67.59% of traders are net-long with the ratio of traders long to short at 2.09 to 1.The number of traders net-long is 1.53% higher than yesterday and 7.12% lower from last week, while the number of traders net-short is 8.49% lower than yesterday and 17.36% higher from last week.We typically take a contrarian view to crowd sentiment, and the fact traders are net-long suggests Gold prices may continue to fall.
Positioning is more net-long than yesterday but less net-long from last week. The combination of current sentiment and recent changes gives us a further mixed Gold trading bias.

What is your view on Gold – bullish or bearish?? You can let us know via the form at the end of this piece or you can contact the author via Twitter @nickcawley1.


