


JSE, SA40 Analysis:
- Massive Naspers-related corporate action and record trading volumes forced a late start to trading yesterday for the Johannesburg Stock Exchange (JSE)
- The disruption to trading sparked large scale selling that gained momentum throughout the current session
- SA40 analyzed against key technical levels
Corporate Action and Record Trading Volumes Shut Down Local Exchange
On Tuesday, the Johannesburg Stock Exchange (JSE) witnessed a record level of trading volume with R145 billion being traded, more than double the previous highest of R71 billion, which lead to a delayed opening on Wednesday.
Criticism has been levelled at the 35 year old ‘Broker Dealer Accounting’ (BDA) system used to process trades which was the main reason for the outage on Wednesday.
What caused the record trading volumes?
A share swap between Naspers, which has the highest weighting in the index, and Prosus, also a JSE heavyweight, resulted in the sale of Naspers shares for newly created shares in Prosus. In addition, large index tracking funds were obliged to sell Naspers and take up Prosus to reflect the new index weightings. This rebalancing exercise added to the already pressurized post-trade processing system.
SA40 Index – Key Technical Levels
The SA40 index is based off the JSE Top 40 Index and tracks the performance of the top 40 South African companies by market capitalization. The SA40 chart below shows how price action unfolded in the hours following the reopening of the exchange at 14:00. There was an immediate drop after the opening auction on Wednesday followed by an even greater drop after this morning’s opening auction.
SA40 Showing Trading in the Hours That Followed the Outage
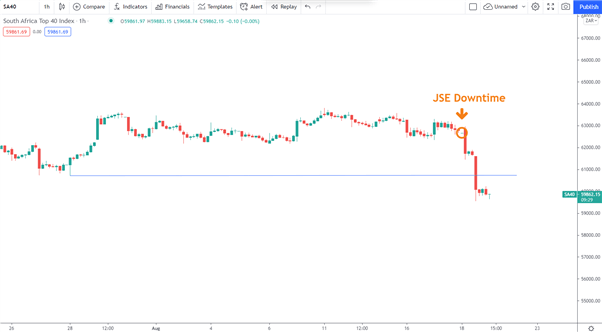
Chart prepared by Richard Snow, IG
The daily chart puts the recent move in perspective as the index has largely traded sideways, between the high of 63,970 and low just below 58,800. Selling momentum continued today as the index trades below the significant psychological level of 60,000 at the time of writing. This is much in line with global equities as risk appetite seems to have subsided in recent trading sessions.

Should the selling continue into Friday, there may be another test of the 59,650 level which would then bring the lower bound of the sideways trading channel into focus at the 58,800 level of support.
SA40 Daily Chart with Key Levels
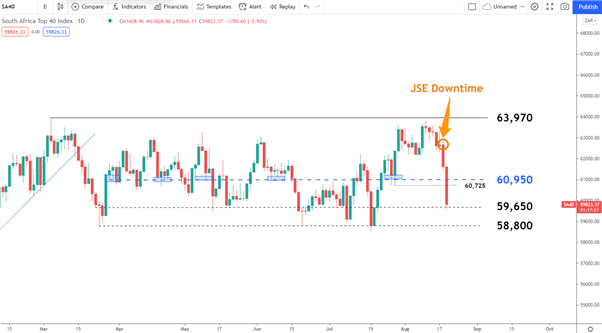
Chart prepared by Richard Snow, IG
Introduction to Technical Analysis
Support and Resistance
Learn how to identify hidden levels of support & resistance
--- Written by Richard Snow for DailyFX.com
Contact and follow Richard on Twitter: @RichardSnowFX


