


RAND ANALYSIS
- Rand hit by risk aversion.
- Positive SA retail sales data unable to sway bullish USD/ZAR.
- Spotlight on FOMC.
ZAR FUNDAMENTAL BACKDROP
Geopolitics, COVID-19, Fed trepidation and uninspiring local data have prompted a bullish bias this week as global risk aversion increased. The South African rand touched July swing highs yesterday and now hovers around 14.9000 after predictable inflation data (see chart below).

Source: Stats SA – Consumer Price Index (CPI)
Retail sales data for June has given some respite to rand bulls as actual figures (10.4%) beat estimates of 9.6%. I believe this will only be temporary as this marginal outperformance remains a minimal factor on the USD/ZAR currency pair.

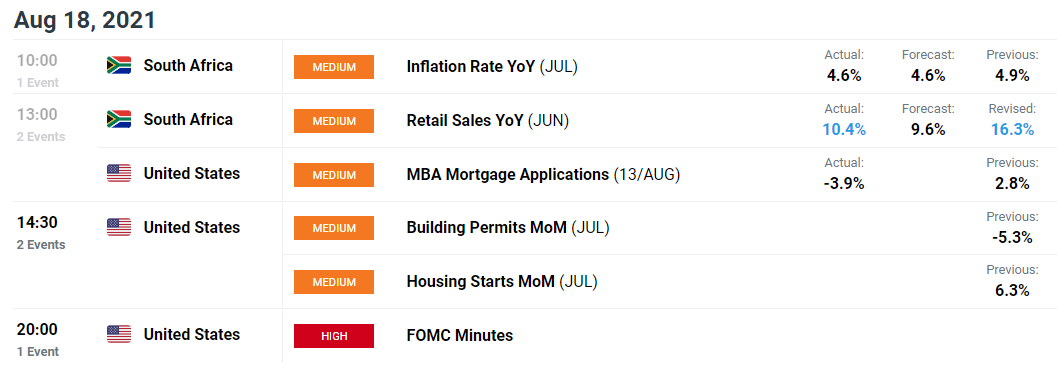
Source: DailyFX economic calendar
Rand linked commodities have also taken a back seat this week with the Chinese port lockdown and slowing economic data. Spot gold, platinum and iron ore are all trading lower for the week thus contributing to rand weakness. Emerging market (EM) currencies are following suit as illustrated by the JP Morgan Emerging Market Currency Index (benchmark for EMs vs USD) below:

Source: Refinitiv
Today, markets will be firmly focused on the upcoming FOMC meeting. It is anticipated that tapering will likely take place at some point between September 2021 – December 2021 but what markets will react to is the manner and structure of the QE taper itself. For example, will the Fed reduce asset purchases by a certain amount at each meeting. The guidance within the announcement later today will hold key information for the dollar going forward. The graphic below shows the significant drop for the rand vs the dollar for 2021. The ZAR has maintained a positive stance against the USD for much of 2021 but now prints in the red which may see further slippage should a hawkish Fed ensue.
Global FX Rates vs USD 2021:
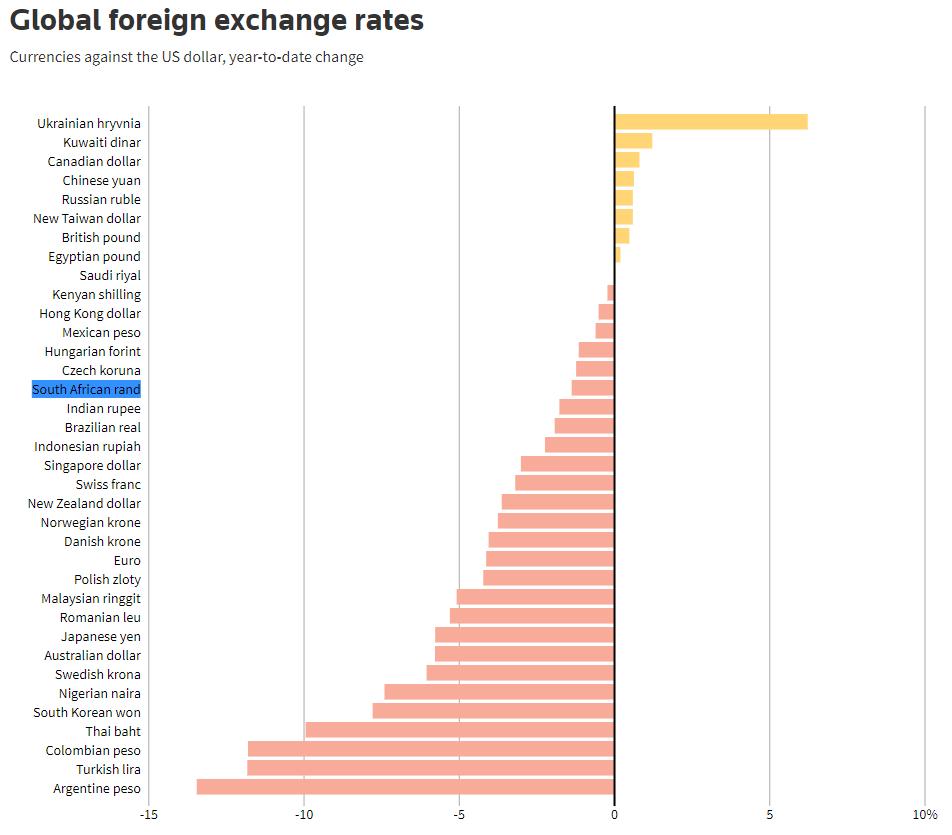
Source: Reuters
GET YOUR Q3 RAND FORECAST HERE!
TECHNICAL ANALYSIS
USD/ZAR DAILY CHART

Chart prepared by Warren Venketas, IG
Monday’s bull pennant (blue) has unfolded in an textbook fashion thus far with price action pushing towards the elusive 15.0000 psychological level. Fundamentally, the short-term bias points to further upside however, FOMC details will be crucial.
The Relative Strength Index (RSI) is steadily rising yet still far away from overbought territory which leaves room for more upside. Near-term support has been provided by the 20-day EMA since last week and should not be discounted as a key area of confluence.
Resistance levels:
- 15.1014 – prior swing high (March 2021)
- 15.0000
Support levels:
- 14.9000
- 14.8000
- 20-day EMA (purple)
--- Written by Warren Venketas for DailyFX.com
Contact and follow Warren on Twitter: @WVenketas


