


S&P 500, HANG SENG INDEX, ASX 200 INDEX OUTLOOK:
- Dow Jones, S&P 500 and Nasdaq 100 closed +0.62%, +0.25%, and -0.17% respectively
- US core inflation rate came in at 4.3%, falling from 4.5% a month ago
- Asia-Pacific markets look set to open higher, with investors waiting for UK GDP growth rate

S&P 500, Core CPI, Southbound Flows, Asia-Pacific at the Open:
Wall Street stocks closed broadly higher on Wednesday as the core CPI rate retreated to 4.3% YoY in July from 4.5% in June (chart below). This is largely in line with market expectations, supporting the Fed’s assessment that reopening price pressures are transitory. The DXY US Dollar index pulled back from a 3-week high, alleviating pressure on commodity and precious metal prices. Gold and crude oil prices rallied overnight.
Meanwhile, President Joe Biden is pushing for unified Democrat support for another $3.5 trillion in social spending, boosting reflation hopes. The cyclically-linked materials, industrials and financial sectors were among the best performers, whereas information technology and healthcare lagged behind.
US Core CPI – Last 12 Months
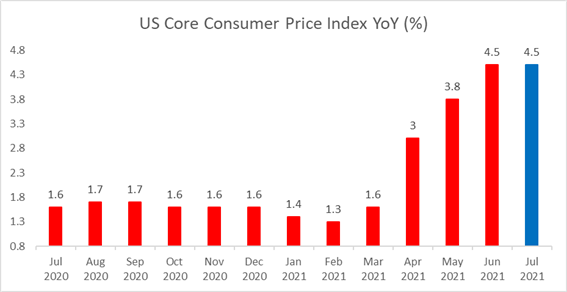
Source: Bloomberg, DailyFX
Looking ahead, UK GDP figures dominate the economic docket alongside US initial jobless claims data. Find out more from the DailyFX economic calendar.
Asia-Pacific markets look set to open higher on Thursday. Futures in Japan, Australia, Hong Kong, Taiwan, Singapore, Malaysia and India are in the green, whereas those in mainland China, South Korea and Thailand are in the red.
The Hang Seng Index (HSI) climbed 0.2% on Wednesday, hitting an immediate resistance level at 26,650. The stock connections registered a total HK$20.75 billion of net Southbound inflows over the last 4 days. This suggests that mainland buyers are returning for bargain hunting after recent regulatory clampdowns.
Hang Seng Index vs. Southbound Daily Net Flow
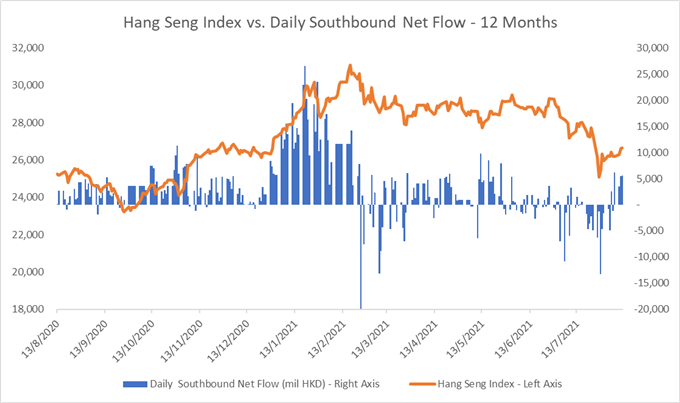
Source: Bloomberg, DailyFX
Looking back to Wednesday’s close, 10 out of 11 S&P 500 sectors ended higher, with 75.4% of the index’s constituents closing in the green. Materials (+1.42%), industrials (+1.30%) and financials (+1.17%) were among the best performers, whereas healthcare (-0.97%) trailed behind.
S&P 500 Sector Performance 11-08-2021
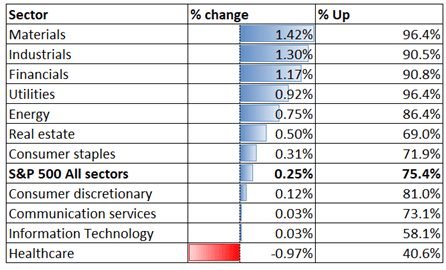
Source: Bloomberg, DailyFX

S&P 500 IndexTechnical Analysis
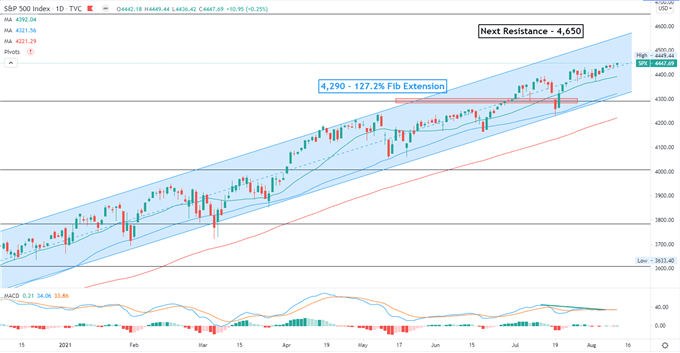
The S&P 500 index is trending higher within an “Ascending Channel” formed since November as highlighted on the chart below. The next key resistance level can be found at 4,650 – the 161.8% Fibonacci extension. The overall trend remains bullish-biased as suggested by the SMA lines. The MACD indicator formed a lower high recently however, hinting at downward momentum.
S&P 500 Index– Daily Chart
Hang Seng Index Technical Analysis:
The Hang Seng Index is challenging the ceiling of a range bound at around 26,650. A successful attempt may intensify near-term buying pressure and carve a path for prices to hit higher highs. The next resistance level can be found at around 27,150 – the 50% Fibonacci retracement. The near-term trend has likely turned positive, as the MACD indicator formed a bullish crossover and trended higher.
Hang Seng Index – Daily Chart

ASX 200 Index Technical Analysis:
The ASX 200 index has breached above a key resistance level at 7,500 – the 200% Fibonacci extension. The overall trend remains bullish-biased, as suggested by the consecutive higher highs and higher lows formed over the past few months. The MACD indicator formed a bullish crossover and trended higher, suggesting that upward momentum is dominating.
ASX 200 Index – Daily Chart


--- Written by Margaret Yang, Strategist for DailyFX.com
To contact Margaret, use the Comments section below or @margaretyjy on Twitter


