


Oil Price and Analysis
- Crude Oil Extends Losses, Down 10% For The Month
- Slowing Demand From Asia Weighs on Oil Outlook
Crude oil prices continue its downtrend as Brent and WTI drop 3.5%, meaning that oil prices are down near enough 10% since the beginning of the month. The spread of the Delta variant remains a concern and increasingly so for Asia. Chinese authorities completed mass testing in Wuhan following recent outbreaks, while China have also imposed domestic travel restrictions in medium to high risk regions, a worrying sign for the crude oil outlook.

Alongside this, growth in China has been slowing, which in turn has prompted analysts to downgrade their economic projections. Among which are Goldman Sachs who cut their Chinese Q3 GDP forecast to 2.3% from 5.8%, while their FY GDP forecast had been lowered to 8.3% from a prior of 8.6%. Over the weekend, the latest Chinese trade balance data reaffirmed the softer demand outlook from Asia as Chinese crude oil imports fell to 9.71mbpd in July from 9.76mbpd in the prior month.
Looking ahead, on the oil front the updates from the EIA Short Term Energy Outlook, OPEC & IEA Monthly Oil Report will provide the latest indications of oil demand growth throughout the rest of H2. Should there be downgrades to oil demand, the downtrend in the crude may have more to go.
On the chart, near term support resides at $67.44, which marks the swing low from the July selloff. Failure to hold leaves crude oil vulnerable to a move towards $64.50-65.50, while on the topside the 100DMA marks the notable resistance level.
Oil Price Chart: Daily Time Frame
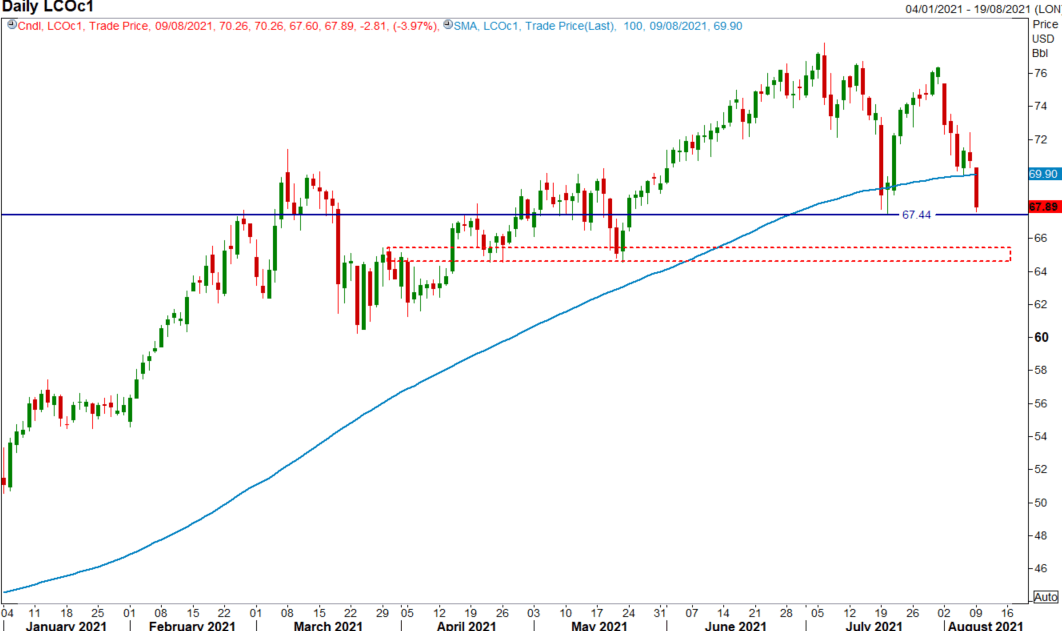
Source: Refinitiv
| Change in | Longs | Shorts | OI |
| Daily | 9% | -16% | 1% |
| Weekly | 36% | -35% | 6% |


