


Gold/Silver Talking Points:
- Gold prices fall below $1,800
- Silver prices stabilize above $25,00
- Non-Farm Payroll report to be key indicator for Fed tapering

Gold prices remain below $1,800 as NFP nears
Gold prices have continued to decline ahead of today’s Non-Farm Payroll report as the Fed continues to track unemployment.
With inflationary figures remaining on the rise, Gold prices have remained relatively unscathed with Silver following suite.
As inflationary pressure continues to weigh on the market, the report is expected to be the Federal Reserve’s leading indicator for tapering and are therefore expected to weigh on major commodities.
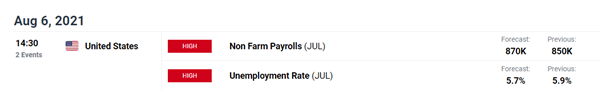
DailyFX Economic Calendar
Gold Technical analysis
In the short-term, Gold prices would need to rise back above the key psychological level of $1,800 for a bullish breakout to be probable. This may be possible if inflation continues to climb and the Delta variant continues to spread concerns of further global lockdowns.
Meanwhile, the recent formation of a Death Cross (the 50 day MA falling below the 200-Day MA) is usually considered to be a bearish indication, bringing the 38.2% Fibonacci retracement into the spotlight as the next level of support at $1,785. With the RSI currently maintaining a neutral stance at 42, the next few weeks will likely bring about an array of volatility to Gold prices as the US continues to factor in current economic conditions.

Gold Daily Chart
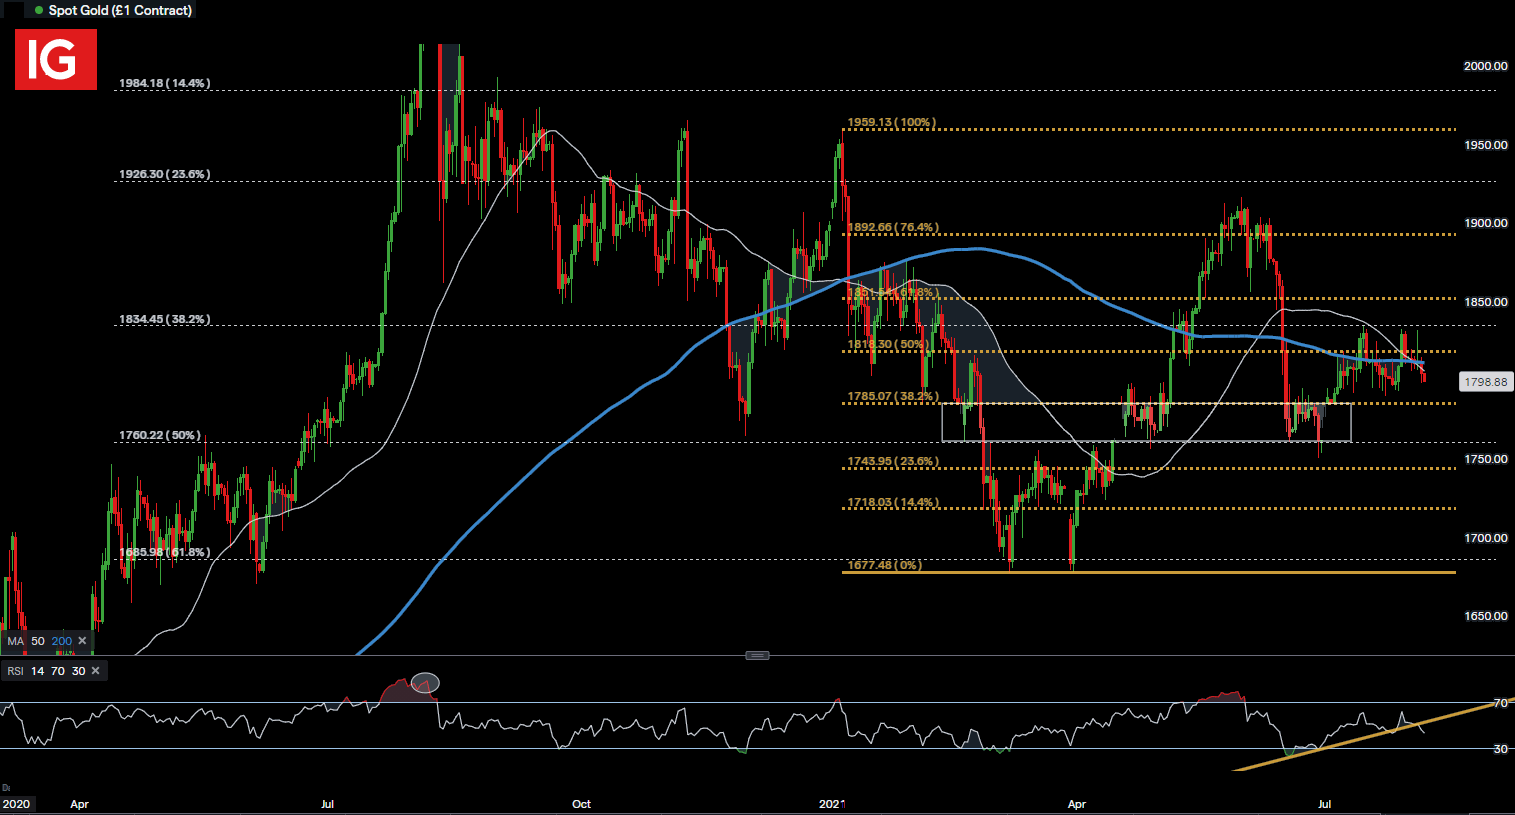
Chart Prepared by Tammy Da Costa using IG Charts
Another key Catalyst for both Gold (XAU/USD) and Silver (XAG/USD) is US treasury Yields which have continued to dwindle in recent times.
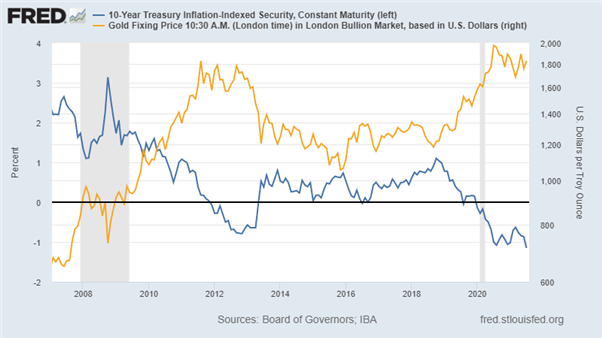
Chart of real bond yields and gold prices
Source : Fred.FedStLouis.Org
Silver Technical Analysis
For Silver, the zone of confluency currently remains between $24 and $26, with price action currently sitting comfortably just above the key psychological level of $25. If prices fall, the next level of support resides at the 61.8% retracement of the historical move at $24,16 while resistance remains at the $26 handle. As with Gold, the RSI is currently within range with price action below trendline resistance.
Silver Daily Chart
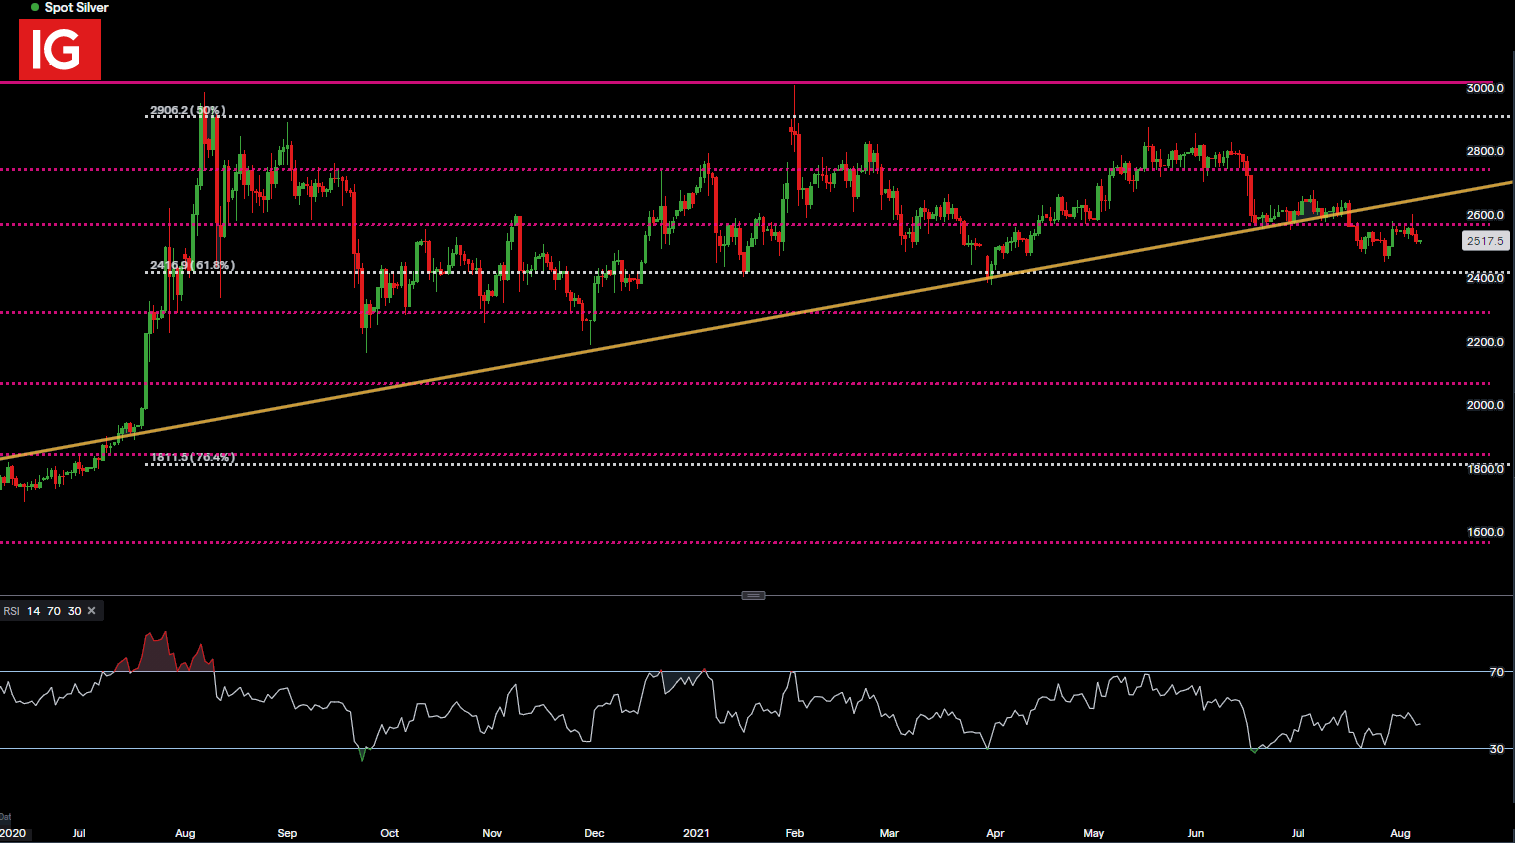
Chart Prepared by Tammy Da Costa using IG Charts
--- Written by Tammy Da Costa, Analyst for DailyFX.com
Contact and follow Tammy on Twitter: @Tams707


