


S&P 500, HANG SENG INDEX, ASX 200 INDEX OUTLOOK:
- Dow Jones, S&P 500 and Nasdaq 100 closed -0.92%, -0.46%, and +0.15% respectively
- Crude oil prices fell for a third day as traders mulled the pandemic’s impact on energy demand
- Asia-Pacific markets look set to open flat, with investors waiting for the US nonfarm payrolls report

S&P 500, Crude Oil, ADP Jobs Report, NFP, Asia-Pacific at the Open:
Wall Street stocks pulled back on Wednesday as falling crude oil prices and a weaker-than-expected ADP private payrolls report dampened sentiment. A rapid Covid-19 flareup around the world is casting a shadow over the energy demand outlook, pulling crude oil prices 7.6% lower over the last three days. The energy and industrial sectors underperformed, whereas pandemic winners, such as information technology and communication services, regained their spotlight.
ADP reported only 330k private jobs added in July, a sharp disappointment from 680k seen in June (chart below). It also fell sharply below the 695kestimate, underscoring a fragile labor market recovery amid fears of the highly contagious Delta variant. The much weaker-than-expected figures hint at a similar backdrop for Friday’s nonfarm payrolls data, which is one of the most important gauges that Fed officials watch for.
Meanwhile, Fed Vice Chairman Richard Clarida said that the central bank is on track for a liftoff on interest rates in 2023 and tapering bond purchases later this year. His hawkish-tilted comment, alongside broad ‘risk off’ sentiment, sent the DXY US Dollar index to a one-week high of 92.27.
US ADP Employment Change – Last 12 Months
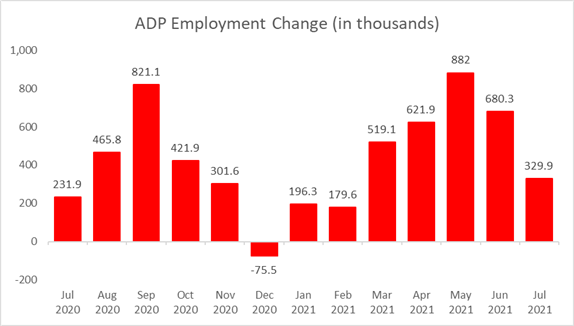
Source: Bloomberg, DailyFX
Looking ahead, the BoE interest rate decision dominates the economic docket alongside US initial jobless claims data. Find out more from the DailyFX economic calendar.
Asia-Pacific markets look set to open mixed on Thursday. Futures in Japan, Australia, Taiwan, Singapore and Malaysia are in the red, whereas those in mainland China, Hong Kong, South Korea, India and Thailand are in the green.
The Hang Seng Index (HSI) rebounded 0.88% on Wednesday as investors attempted to buy the dips after the recent regulatory clampdowns hammered big tech firms such as Tencent, Alibaba, Meituan and JD.COM. While lower share prices may encourage bargain hunting, regulatory risks remain on top of investors’ mind and may limit the extent of the rebound.
Looking back to Wednesday’s close, 9 out of 11 S&P 500 sectors ended lower, with 76% of the index’s constituents closing in the red. Energy (-2.93%), industrials (-1.37%) and consumer staples (-1.26%) were among the worst performers, whereas communication services (+0.23%) and information technology (+0.19%) outperformed.
S&P 500 Sector Performance 04-08-2021
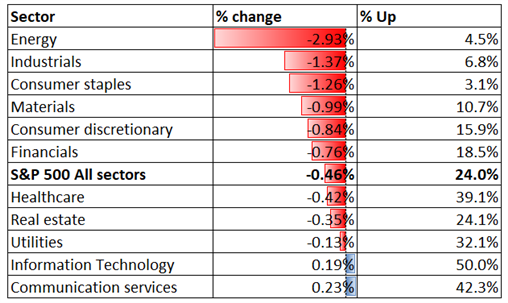
Source: Bloomberg, DailyFX

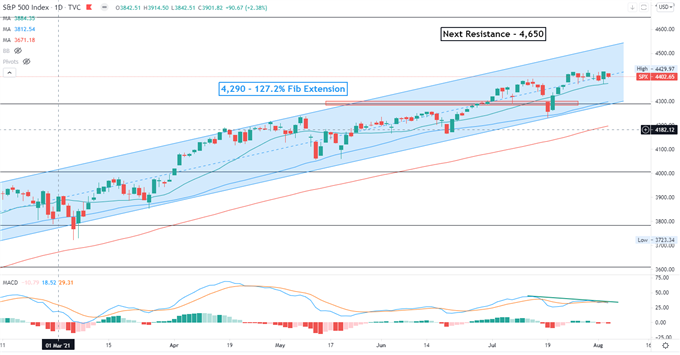
S&P 500 IndexTechnical Analysis
The S&P 500 index is trending higher within an “Ascending Channel” formed since November as highlighted on the chart below. The next key resistance level can be found at 4,650 – the 161.8% Fibonacci extension. The overall trend remains bullish-biased as suggested by the SMA lines. The MACD indicator formed a lower high recently however, hinting at downward momentum.
S&P 500 Index– Daily Chart
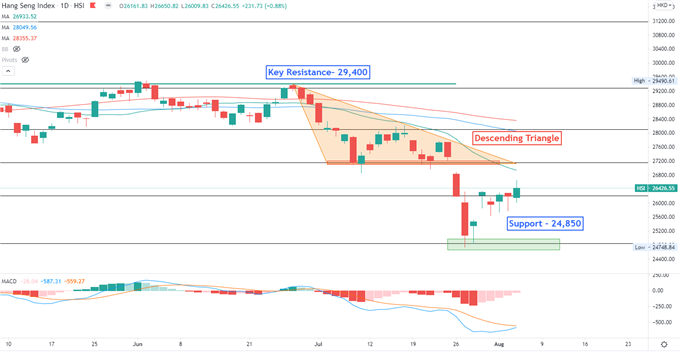
Hang Seng Index Technical Analysis:
The Hang Seng Index rebounded at a key support level of 24,850 after falling almost 10% in three days. Prices breached below the floor of a “Descending Triangle”, hinting at further consolidation ahead. The overall trend remains bearish-biased, as the SMA lines have formed a “Death Cross” and trended lower. The MACD indicator formed a bullish crossover beneath the neutral midpoint, suggesting that selling pressure may be fading.
Hang Seng Index – Daily Chart
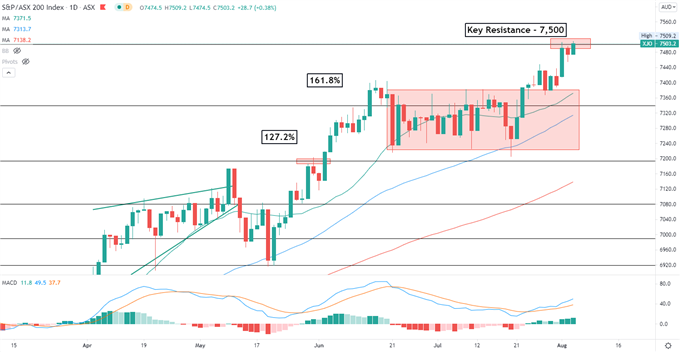
ASX 200 Index Technical Analysis:
The ASX 200 index is challenging a key resistance level at 7,500 – the 200% Fibonacci extension. The overall trend remains bullish-biased, as suggested by the consecutive higher highs and higher lows formed over the past few months. The MACD indicator formed a bullish crossover and trended higher, suggesting that upward momentum is prevailing.
ASX 200 Index – Daily Chart

--- Written by Margaret Yang, Strategist for DailyFX.com
To contact Margaret, use the Comments section below or @margaretyjy on Twitter


