
UK GDP, BRITISH POUND, BANK OF ENGLAND, GBP/USD - TALKING POINTS:
- British Pound down as May’s UK GDP report undershoots forecasts
- Softening data flow has flattened UK yield curve, punishing Sterling
- GBP/USD may be topping, but a near-term bounce could be ahead

The British Pound ticked lower as the May UK GDP report fell short of baseline forecasts. The economy grew 0.8 percent on the month, whereas economists were looking for a rise of 1.5 percent. Industrial and manufacturing production readings released alongside the GDP report were also disappointing, as were construction output figures.
This seemingly speaks to a broader trend. UK economic data outcomes have deteriorated relative to expectations since late May, according to data from Citigroup. The British Pound has fallen alongside a narrowing of the spread between 2- and 10-year Gilt yields, implying that traders are interpreting recent news-flow as diminishing scope for monetary policy normalization at the Bank of England.
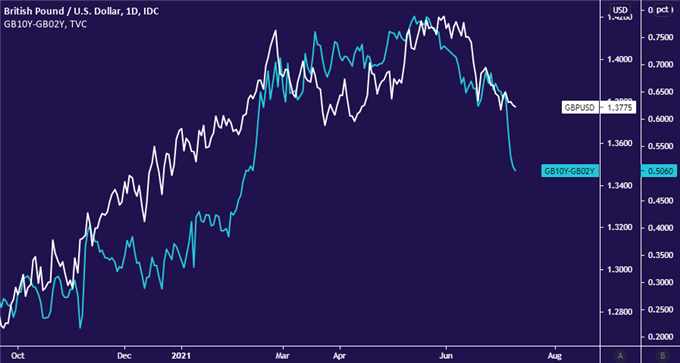
Chart created with TradingView
Next week’s release of June’s UK CPI report marks the next major inflection point on the economic data docket. It is expected to show that the headline inflation rate ticked up from 2.1 to 2.3 percent on year, marking an almost three-year high. However, BOE Governor Andrew Bailey and company have dismissed near-term reflation as a function of temporary base effects following last year’s Covid-19 outbreak.
By contrast, the Federal Reserve has started to begrudgingly admit that price growth has exceeded policymakers’ prognostications. June’s fateful FOMC policy meeting introduced previously absent rate hikes into the three-year outlook. Markets have gone a step further, with Fed Funds futures baking in one hike in 2022 in addition to two more in 2023.

GBP/USD TECHNICAL ANALYSIS – DOUBLE TOP REVERSAL TAKING SHAPE?
GBP/USD may have carved out a bearish Double Top pattern above the 1.42 figure against this backdrop. However, near-term positioning reveals the emerging outline of a Falling Wedge pattern coupled with positive RSI divergence. This speaks to ebbing downside momentum and may precede a bounce. Near-term resistance levels line up at 1.39 and 1.40.
Alternatively, a daily close below the Double Top neckline in the 1.3667-88 zone would confirm the bearish setup, implying a measured move lower targeting just above the 1.31 figure to follow. A more immediate support cluster sits around the 1.35 handle and ma provide friction along the way in the event that sellers retain the upper hand.
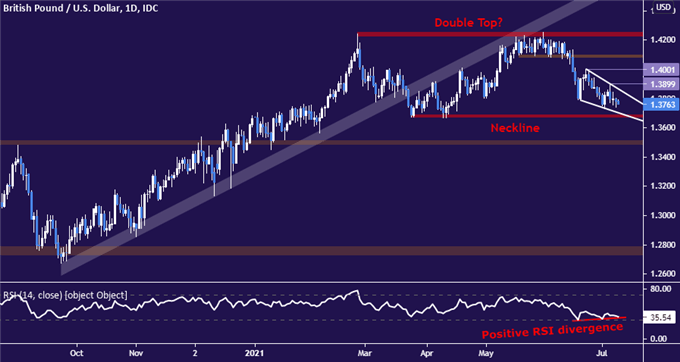
Chart created with TradingView
GBP/USD TRADING RESOURCES
- Just getting started? See our beginners’ guide for FX traders
- Having trouble with your strategy? Here’s the #1 mistake that traders make
- Join a free live webinar and have your trading questions answered
--- Written by Ilya Spivak, Head Strategist, APAC for DailyFX
To contact Ilya, use the comments section below or @IlyaSpivak on Twitter