


GOLD PRICE OUTLOOK:
- Gold prices are trading lower on Monday following strong US inflation readings
- Hawkish-biased comments from the Boston Fed president also weighed on bullion
- Traders are eyeing $1,750 for support, breaching which may lead to further losses

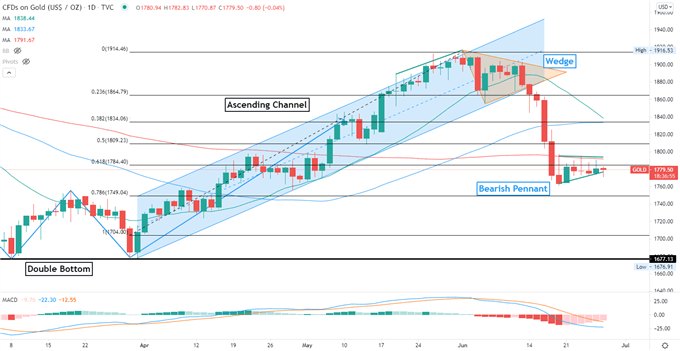
Gold prices traded mildly lower during Monday’s APAC session, as strong US inflation readings and hawkish-biased comments from Boston Fed President Eric Rosengren spurred a new wave of selling. Prices continued to consolidate in a tight range between $1,760 - $1,795, forming a “Bearish Pennant” pattern. The DXY US Dollar index remains steady, and the 10-year Treasury yield is edging higher - both are exerting downward pressure on gold.
The US core PCE index - the Fed’s key inflation gauge - came in at 3.4% YoY in May. This marks the highest level seen since 1992 as raw materials and labor costs surged against the backdrop of pent-up demand for goods and services. A low-base effect has also contributed to the higher YoY reading. Rising inflationary pressures and a strong economic recovery ignited a debate among Fed officials about when and at what pace the central bankshould scale back its asset purchases and start to raise interest rates.
Eric Rosengren is the latest Fed member who showed a hawkish stance, following St. Louis Fed President James Bullard, Dallas’ Robert Kaplan and Atlanta’s Raphael Bostic. Rosengren said that conditions may be met by the end of this year for the Fed to slow down asset purchases, followed by an interest rate hike by the end of 2022. This is even earlier than the June FOMC projection of two rate hikes by the end of 2023.
Gold has been riding the tailwind of the ultra-low interest rate environment and central banks’ quantitative easing since the onset Covid-19 pandemic, and thus it may be more vulnerable to a pullback when the reversal in monetary policy trajectory begins. As a result, near-term momentum may be tilted to the downside as tapering fears weigh.
US Core PCE Index (YoY) – Past 12 Months
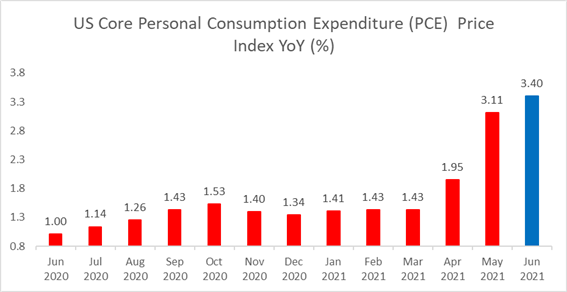
Source: Bloomberg, DailyFX
Gold Price Technical Analysis
Technically, gold prices have likely formed a “Bearish Pennant” as shown on the chart below. A Pennant is a continuation chart pattern, usually seen after a large upward or downward movement and marking brief consolidation before prices continue to move in the direction of the dominant trend. A “Bearish Pennant” hints at further downside potential if prices breach below trendline support.
An immediate support level can be found at $1,750 – the 78.6% Fibonacci retracement. The MACD indicator formed a bearish crossover and trended lower, suggesting that bearish momentum is dominating.
Gold Price – Daily Chart
| Change in | Longs | Shorts | OI |
| Daily | 3% | -5% | -1% |
| Weekly | 12% | 3% | 7% |
--- Written by Margaret Yang, Strategist for DailyFX.com
To contact Margaret, use the Comments section below or @margaretyjy on Twitter


