


S&P 500, HANG SENG, ASX 200 INDEX OUTLOOK:
- Dow Jones, S&P 500 and Nasdaq 100 closed -0.77%, -0.54%, and -0.34% respectively
- The Fed signalled 2 rate hikes by the end of 2023 in the dot plot and started a discussion about tapering QE during the June FOMC meeting
- More than 80% of the S&P 500 constituents ended lower, setting a sour tone for the APAC markets

FOMC, Dot Plot, Oil, Gold, US Dollar, Yields, Asia-Pacific at Open:
Wall Street stocks pulled back broadly after the FOMC meeting, while the US Dollar and Treasury yields surged. The Fed gave hawkish-biased signals during the June meeting, revising up economic projections and hinting at a faster pace of rate hikes in the dot plot. The latest projection showed that 13 out of 18 Fed officials voted for hikes before the end of 2023, compared to 7 in the March meeting (chart below). The forecasted medium Federal Funds Rate is 0.6% by the end of 2023, implying 2 rate hikes during that year. Meanwhile, the Fed officials have started a discussion about scaling back bond purchases, but any actions may still be months away.
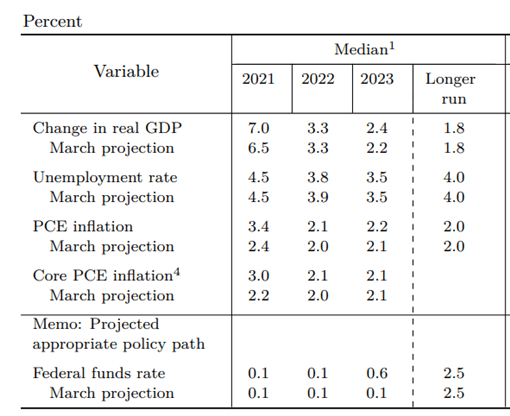
Encouragingly, the Fed painted a rosy picture on the economic recovery. The committee foresees a 7.0% GDP growth rate for this year, compared to a 6.5% forecast in March. Inflation is expected to pick up at a faster pace, with PCE and core PCE expected to hit 3.4% and 3.0% respectively this year, compared to 2.4% and 2.2% in the March projection. A brighter economic outlook may underpin stock market performance and limit the extent of a pullback.
The DXY US Dollar index surged nearly 1% overnight to a two-month high of 91.42, weighing on commodity prices and emerging market assets. Gold prices tumbled 2.55% to a one-month low of $1,818, and crude oil prices retreated from the recent peak. This may cast a shadow over commodity-linked currencies such as the Canadian and Australian Dollars, as well as the Norwegian Krone.
Economic projections of Federal Reserve Board Members – June 2021
Federal Reserve Dot Plot – June 16th 2021
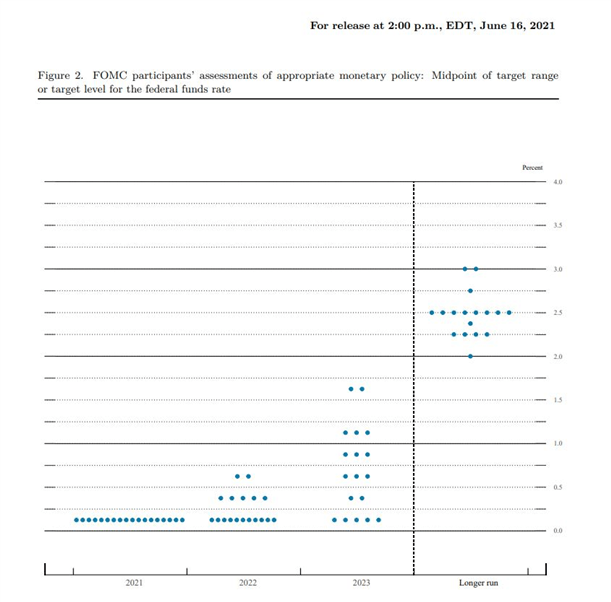
Source: Federalreserve.gov
Asia-Pacific markets look set to open broadly lower. Futures in mainland China, Australia, Hong Kong, Taiwan, Malaysia, India and Thailand are in the red, whereas those in Japan, South Korea and Singapore are slightly higher.
Hong Kong’s Hang Seng Index (HSI) looks set to pull back further and test a key support level of 28,300. A strengthening US Dollar means that stock prices of Chinese firms listed in Hong Kong may fall because they are denominated in HKD – a currency that is pegged to the US Dollar – whilst the underlying assets are denominated in Chinese Yuan. A tightening prospect of the Fed’s monetary policy may also weigh on sentiment, especially for the technology, real estate and aviation sectors.
Looking ahead, Australian jobs data leads the economic docket alongside Euro Area core inflation and US initial weekly jobless claims data. Find out more from DailyFX economic calendar.
Looking back to Wednesday’s close, 10 out of 11 S&P 500 sectors ended lower, with 80.2% of the index’s constituents closing in the red. Utilities (-1.49%), consumer staples (-1.24%) and materials (-1.17%) were among the worst performers, whereas consumer discretionary (+0.16%) was the only sector closed in the green.
S&P 500 Sector Performance 16-10-2021
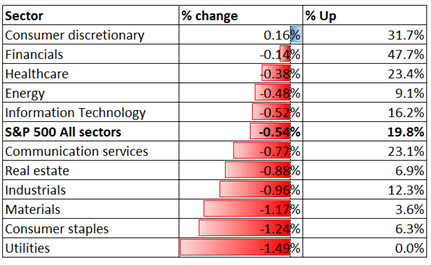
Source: Bloomberg, DailyFX

S&P 500 IndexTechnical Analysis
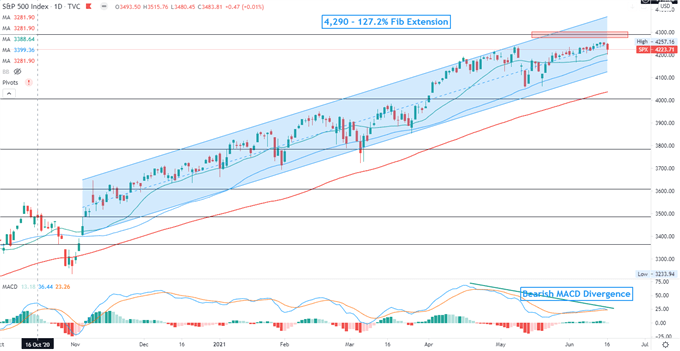
The S&P 500 index is extending higher within an “Ascending Channel” formed since November. The overall bullish trend remains intact, but prices may be facing some pressure at around 4,290 – the 127.2% Fibonacci extension. Bearish MACD divergence hints that upward momentum may be fading as the index shows reluctancy to move decisively higher. A pullback may lead to a test of the 20- and 50-day SMA lines for immediate supports.
S&P 500 Index– Daily Chart
Hang Seng Index Technical Analysis:
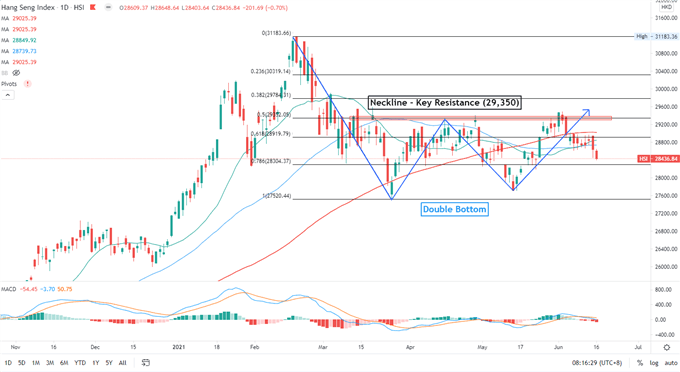
The Hang Seng Index failed to breach the neckline of the “Double Bottom” pattern and has since entered a technical pullback. Prices may continue to range bound between 28,300 and 29,350 waiting for fresh catalyst. Breaching below 28,300 may lead to further losses with an eye on 27,600 for support. The MACD indicator is trending lower, suggesting that momentum may be tilted to the downside.
Hang Seng Index – Daily Chart
ASX 200 Index Technical Analysis:
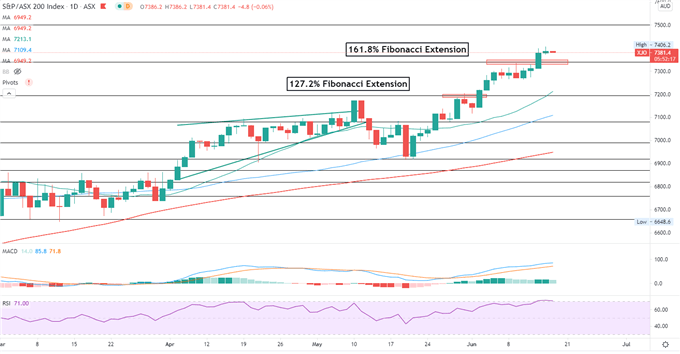
The ASX 200 index breached above a key resistance level of 7,340 and closed at a fresh record on Wednesday. Prices formed consecutive higher highs and higher lows, marking a classic uptrend. The RSI oscillator has reached the overbought threshold of 70, hinting that the index may be temporarily overbought and may entice profit taking. The MACD indicator formed a bullish crossover and trended higher, suggesting that upward momentum is dominating.
ASX 200 Index – Daily Chart

--- Written by Margaret Yang, Strategist for DailyFX.com
To contact Margaret, use the Comments section below or @margaretyjy on Twitter


