


RAND ANALYSIS
- Rates unchanged however 2023 dot plot changes
- Heavier lockdown restrictions in South Africa
The Federal Reserve met today which resulted in an expected “no change” in interest rates ( see calendar below) but what bolstered the U.S. dollar and hence USD/ZAR was the change in 2023 projections. These projections were more hawkish than initially forecasted as eluded in my previous article. The updated dot plot shows two hikes in 2023 while inflation concerns were muted by Fed Chair Jerome Powell during the press conference as he mentioned lower forecasted inflation in 2022. This being said, the Fed still maintains an accommodative stance which should hamper the greenbacks ability to climb higher just yet; which favors short-term Rand strength over the next month or two ahead of the Jackson Hole symposium in late August.
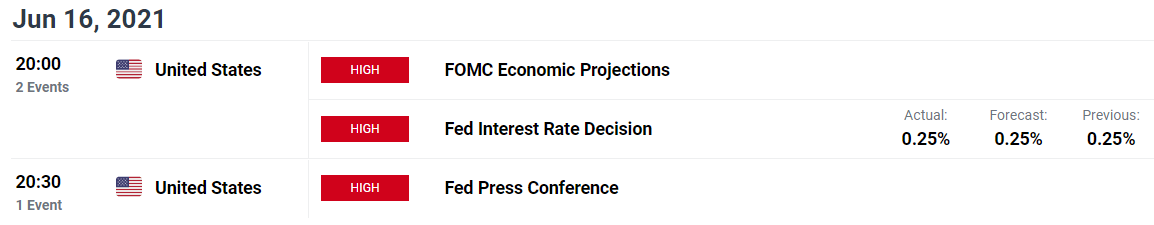
Source: DailyFX Economic Calendar

PRESIDENT CYRIL RAMAPHOSA PUSHES SOUTH AFRICA TO ALERT LEVEL 3
As COVID-19 cases continue to rise, President Cyril Ramaphosa increased restrictions on the country which will likely negatively impact local businesses including manufacturing. This could work against Rand strength which may exacerbate any adverse external global factors.
RAND TECHNICAL ANALYSIS
Visit the DailyFX Educational Center to discover more on price action and chart formations !
USD/ZAR 4-Hour Chart:

Chart prepared by Warren Venketas, IG
USD/ZAR touches the 14.0000 psychological level which is providing some resistance as the markets initial reaction withdraws. In my previous analysis I mentioned a possible bear flag (yellow) forming which has been unwound due to USD strength after the Fed announcement. However, after the market digests recent news we may see a correction lower.
The Relative Strength Index (RSI) has now breached overbought levels on this time frame which backs the notion of a possible pullback toward support.
Should USD/ZAR close above the 14.0000 resistance zone, the May swing high will serve as subsequent resistance at 14.0287. From the bearish perspective, yesterday’s swing high 13.8572 will provide a support target should price action lose its recent upward momentum.
--- Written by Warren Venketas for DailyFX.com
Contact and follow Warren on Twitter: @WVenketas


