


GBP/USD PRICE OUTLOOK: US DOLLAR HINGES ON FRESH FED GUIDANCE
- GBP/USD price action has gravitated roughly 150-pips lower from its recent swing high
- Pound-Dollar might rally if this week’s Fed meeting undermines the threat of tapering
- GBP/USD one-week implied volatility suggests this FOMC update could lack fireworks
- Visit the DailyFX Education Center or read up on these US Dollar trading strategies

GBP/USD currently hovers near the lower end of its recent trading range after sliding 150-pips from its 31 May swing high at the 1.4250-price level. The Pound Sterling has likely faced headwinds with covid cases on the rise across the UK again. In fact, this just prompted Prime Minister Boris Johnson to delay reopening efforts until 19 July.
Meanwhile, the US Dollar appears to be holding up quite well despite last week’s sharp decline in ten-year Treasury bond yields. Perhaps this follows US Dollar bears easing off the gas pedal due to event risk posed by the FOMC rate decision due on Wednesday. And to be fair, the shorter end of the Treasury yield curve (e.g. two-year) has not seen as much downward pressure.
| Change in | Longs | Shorts | OI |
| Daily | 0% | -17% | -6% |
| Weekly | -1% | -4% | -2% |
GBP/USD could extend its drop if this week’s Fed meeting reveals a hawkish shift in monetary policy guidance. Markets will likely pay close attention to the updated Fed dot plot and language changed in the press statement. Two FOMC officials upgrading their estimated midpoint target range for the federal funds rate would stand to signal liftoff for benchmark interest rates by the end of 2023. Any tweaks made to the ‘substantial further progress’ goalpost could explicitly allude to the kickoff of Fed taper talks.
GBP/USD PRICE CHART: DAILY TIME FRAME (15 FEBRUARY TO 14 JUNE 2021)
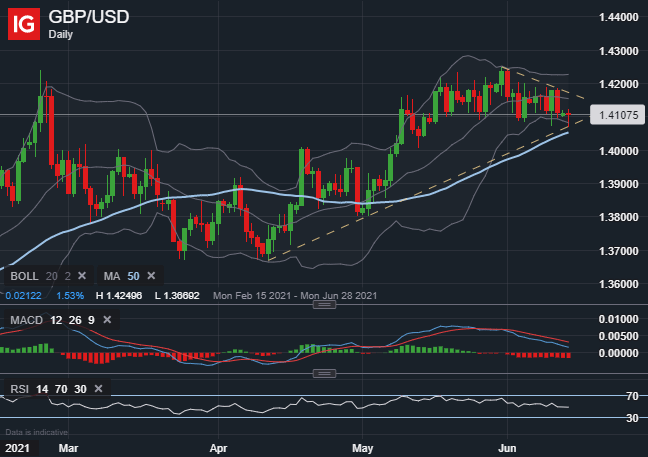
Judging by US Dollar implied volatility readings, however, FX options traders see this as a relatively low probability scenario. GBP/USD one-week implied volatility of 6.1% compares to the average reading of 9.0% headed into the last six Fed meetings, which suggests the FOMC update on deck will likely be an echo of the status quo. That said, the US Dollar might weaken and send GBP/USD price action recoiling higher if Fed hawks are disappointed and forced to unwind taper bets.

This brings to focus ascending trendline support as a nearside layer of defense for GBP/USD bulls. Taking out this technical barrier could see GBP/USD challenge its 50-day simple moving average before the 1.4000-level comes into consideration. Maintaining altitude around last week’s low might help fuel a rebound by GBP/USD price action toward the 1.4200-handle. Eclipsing the 10 June close could invalidate the short-term bearish trend and open up the door for GBP/USD to eye year-to-date highs.
Keep Reading – US Dollar Outlook: DXY Aims Higher on Robust Data, Taper Risk
-- Written by Rich Dvorak, Analyst for DailyFX.com
Connect with @RichDvorakFX on Twitter for real-time market insight


