


RAND ANALYSIS
- USD/ZAR braces for FOMC on Wednesday
- Local landscape looks positive for Rand sustenance
- Bear flag pattern telling on 4-hour chart
The South African Rand has opened the week rather cautiously which is unsurprising as we approach key data releases later this week. Most notably the Federal Reserve interest rate decision on Wednesday (see calendar below).
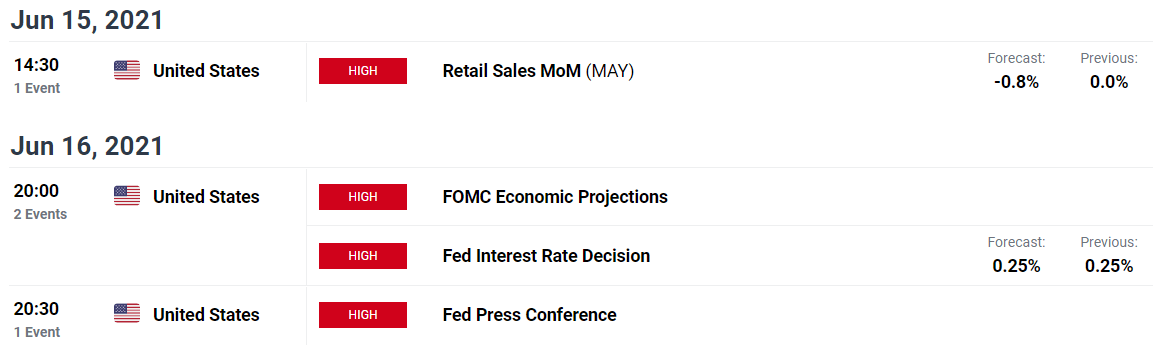
Source: DailyFX Economic Calendar

POSSIBLE CHANGES LOOMING ON FED DOT PLOT PREDICTIONS
Just a reminder on the current Fed dot plot (projection of the federal funds rate) in the chart below, which could be in for a slight adjustment after Wednesdays meeting. As quoted in a recent Bloomberg survey, “the median of 18 officials penciling in at least one 2023 increase. The remainder sees no liftoff from near-zero rates until 2024 at the earliest, mirroring the Fed’s forecast in March.”
While with regard to monetary stimulus, “some 40% expect the Fed to take its first step toward tapering its current $120 billion in monthly bond purchases in late August.”
Any potential change irrespective of the time interval (2023), could result in notable price fluctuations on USD crosses.
Current Fed dot plot:
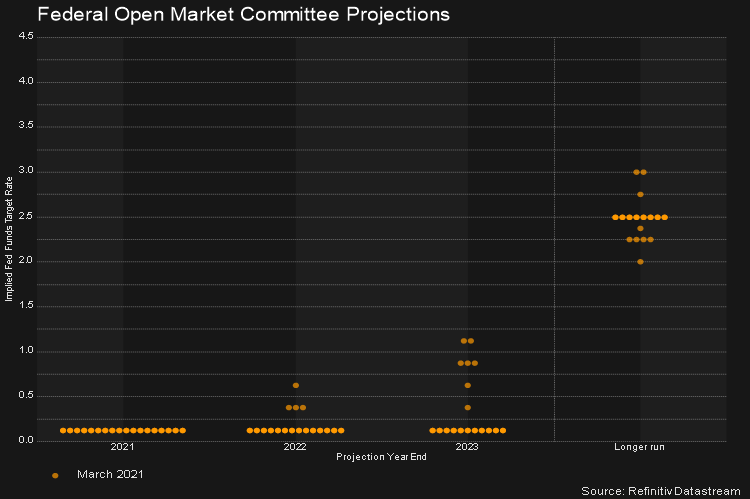
Source: Refinitiv Datastream
SOUTH AFRICAN PERSPECTIVE REMAINS BULLISH FOR NOW
Rand linked commodities such as iron ore and platinum have been relatively strong recently which have buoyed the local currency, while political question marks around corruption are gradually being dispensed with the recent suspension of Ace Magashule.
Other concerns involving State Owned Enterprises (SOEs) such as South African Airways (SAA) and Eskom are showing signs of rectification albeit marginal. A 51% share in SAA has been sold to Harith General Partners of which a 30% stake is held by the Public Investment Corporation (PIC). Eskom on the other hand has reduced its ballooning debt from R496bn to R401bn. This is the first time in fifteen years that any Eskom CEO has managed to achieve such a feat.
The carry trade still remains as a supportive component of the short-term outlook of the Rand which should keep it fairly strong as we enter Q3.
Offsetting these positive factors, COVID-19 cases in South Africa have been increasing steadily as a possible third wave threatens. This has largely had minimal effect on the local currency however looking back at the previous two waves, a marginal Rand weakening seemed to have presented itself mid-latter way through the peak of the respective wave/s. This could be something to consider should a third wave materialize.
USD/ZAR vs COVID-19 new cases South Africa:
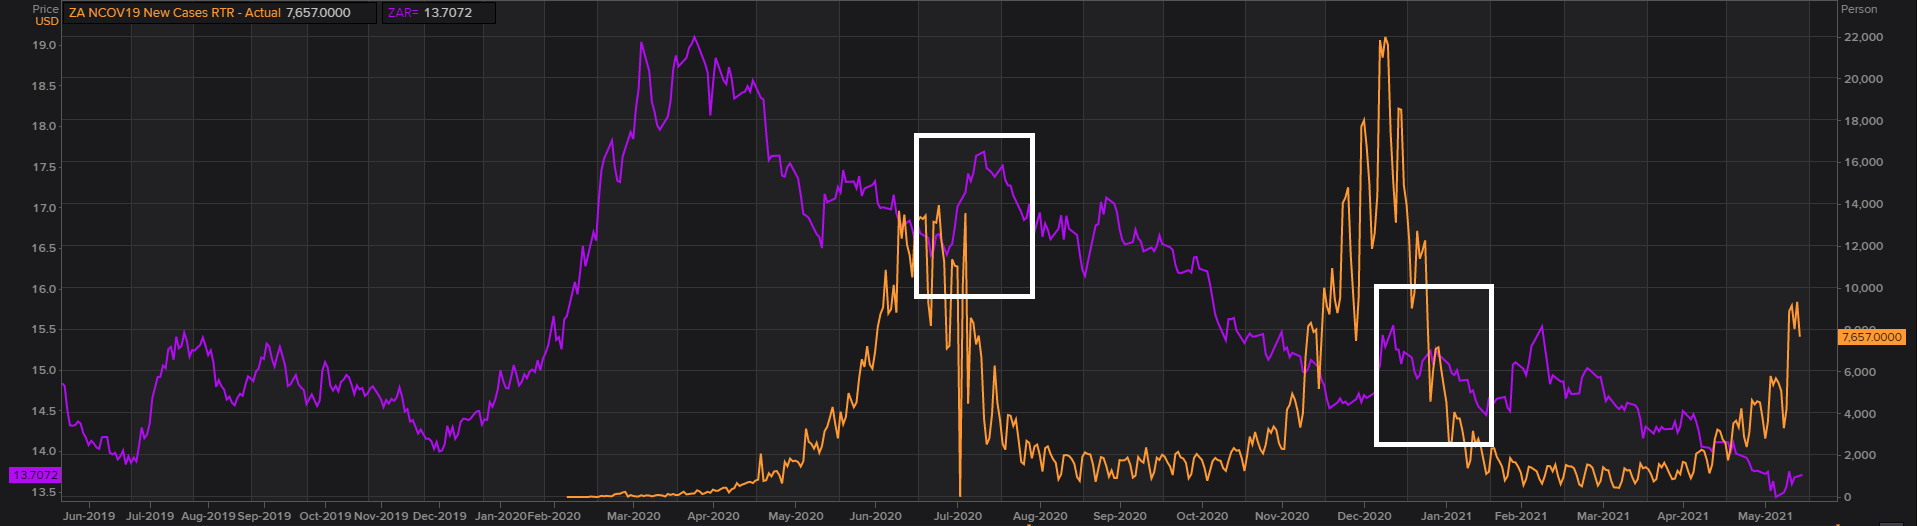
Source: Refinitiv Datastream
RAND TECHNICAL ANALYSIS
Visit the DailyFX Educational Center to discover more on price action and chart formations !
USD/ZAR Daily Chart:
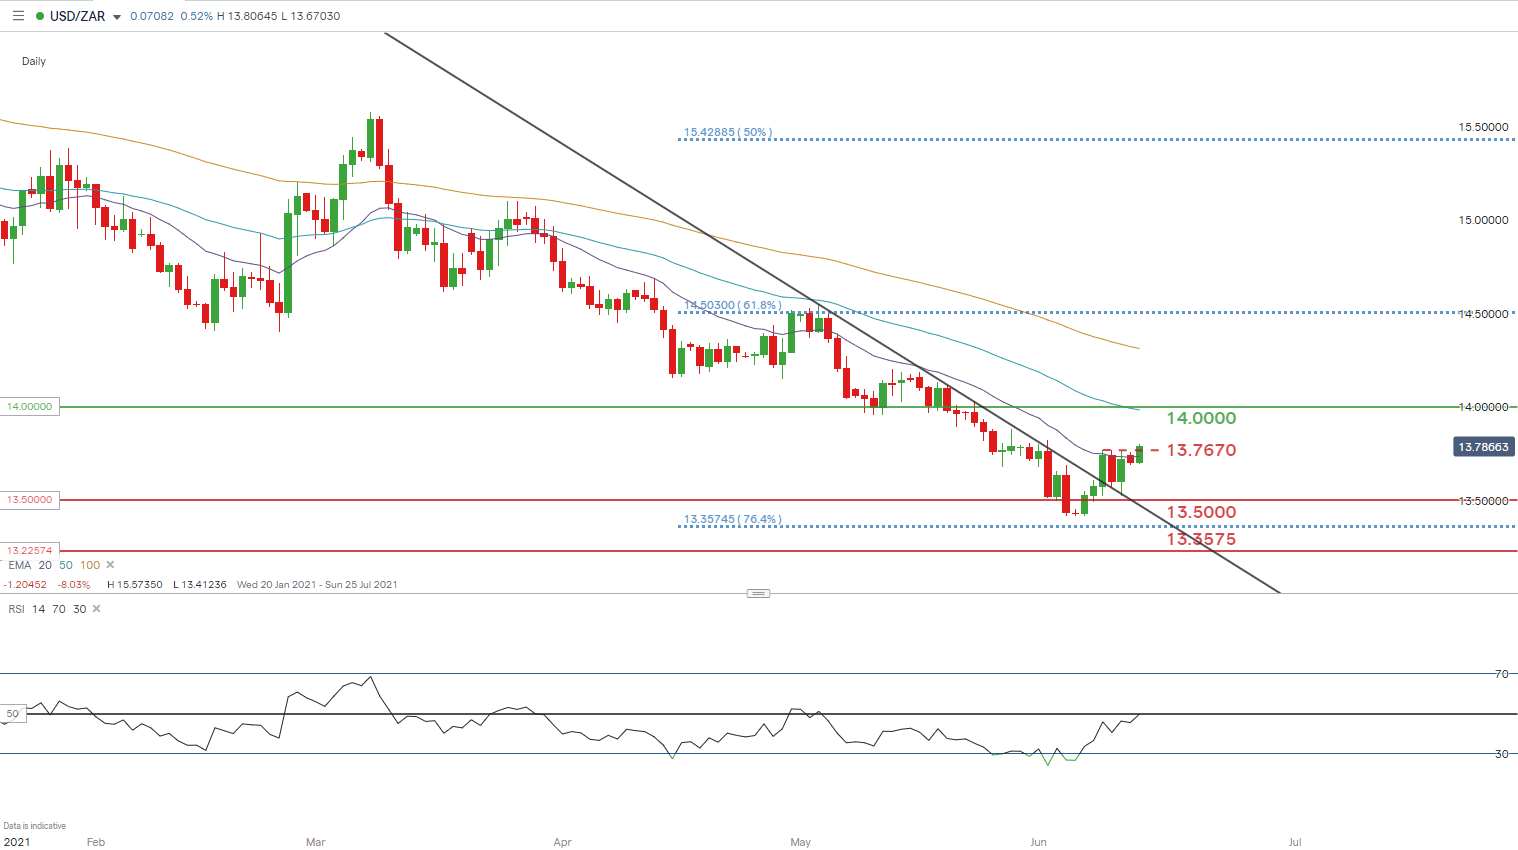
Chart prepared by Warren Venketas, IG
This week USD/ZAR has pushed above last weeks swing high at 13.7670 now serving as near-term support. Consequently, the 20-day Exponential Moving Average (EMA) has been breached as well.
The Relative Strength Index (RSI) reading has swiftly moved up toward the 50 level which is the midpoint between bullish and bearish momentum. Should we close above this level, we could see a change in perspective which has previously occurred in late February this year.
Going forward, bulls will be looking toward the 14.0000 psychological level as initial resistance, which may coincide with the 50-day EMA. Bears will be looking for a pullback below 13.7670 after which 13.5000 comes back into focus.
USD/ZAR 4-Hour Chart:
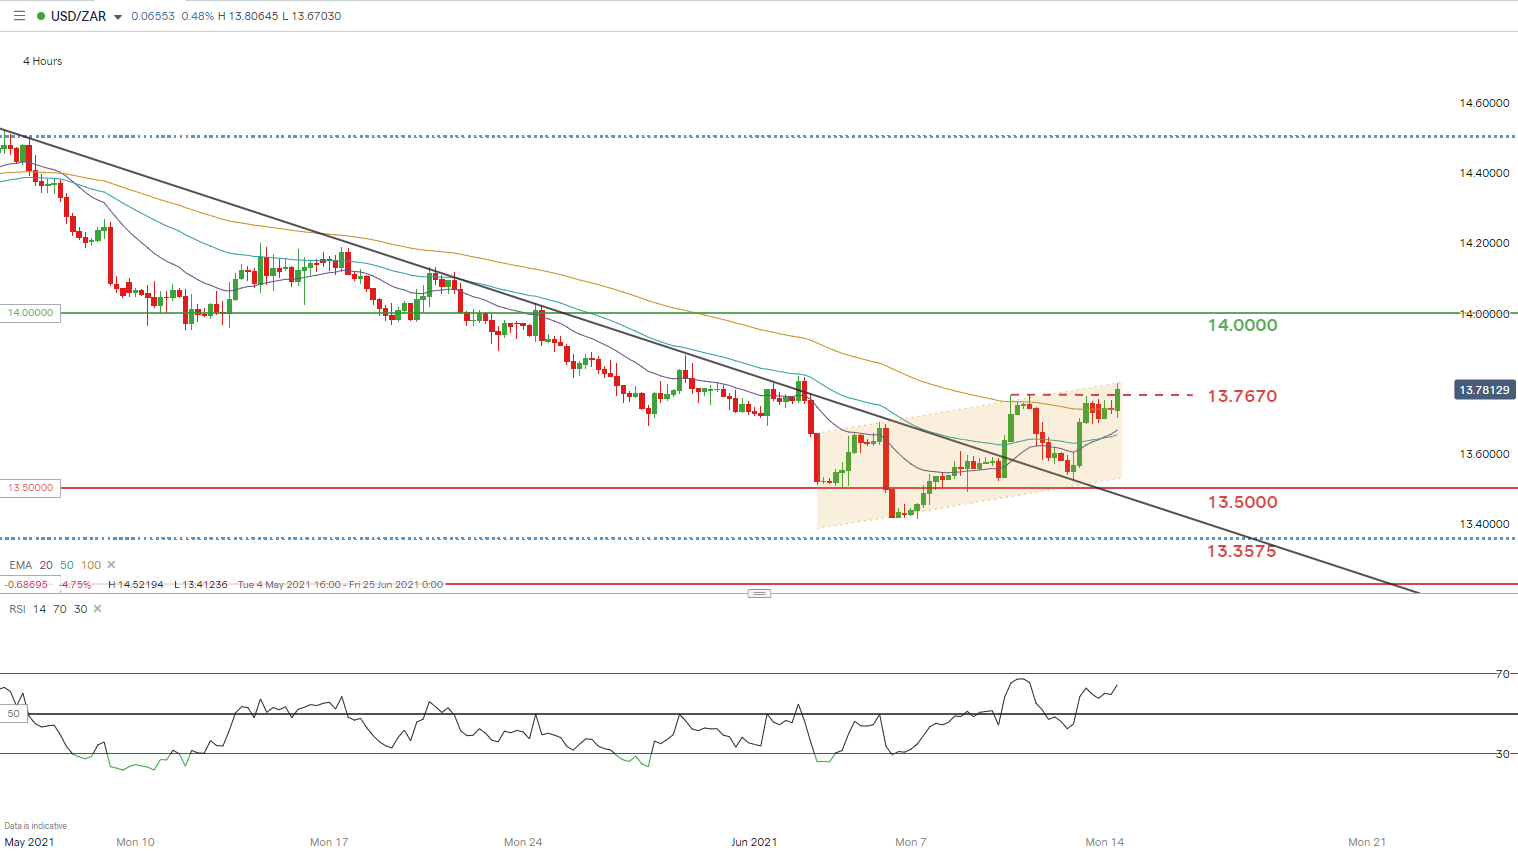
Chart prepared by Warren Venketas, IG
Price action on the 4-hour chart creates a picture of a possible impending continuation of the preceding downtrend. A textbook bear flag chart pattern may be forming (yellow) which could see further Rand strength should prices fall below flag support. Recent upside is also evident from the bullish crossover reflected by the 20-day EMA crossing above the 50-day EMA last night. The technical analysis above falls in line with the aforementioned fundamental outlook which could unfold post-FOMC.
--- Written by Warren Venketas for DailyFX.com
Contact and follow Warren on Twitter: @WVenketas


