


Gold (XAU/USD) Analysis, Price, and Chart
- Trend support survives its first test of strength.
- Retail traders cut their short positions back.

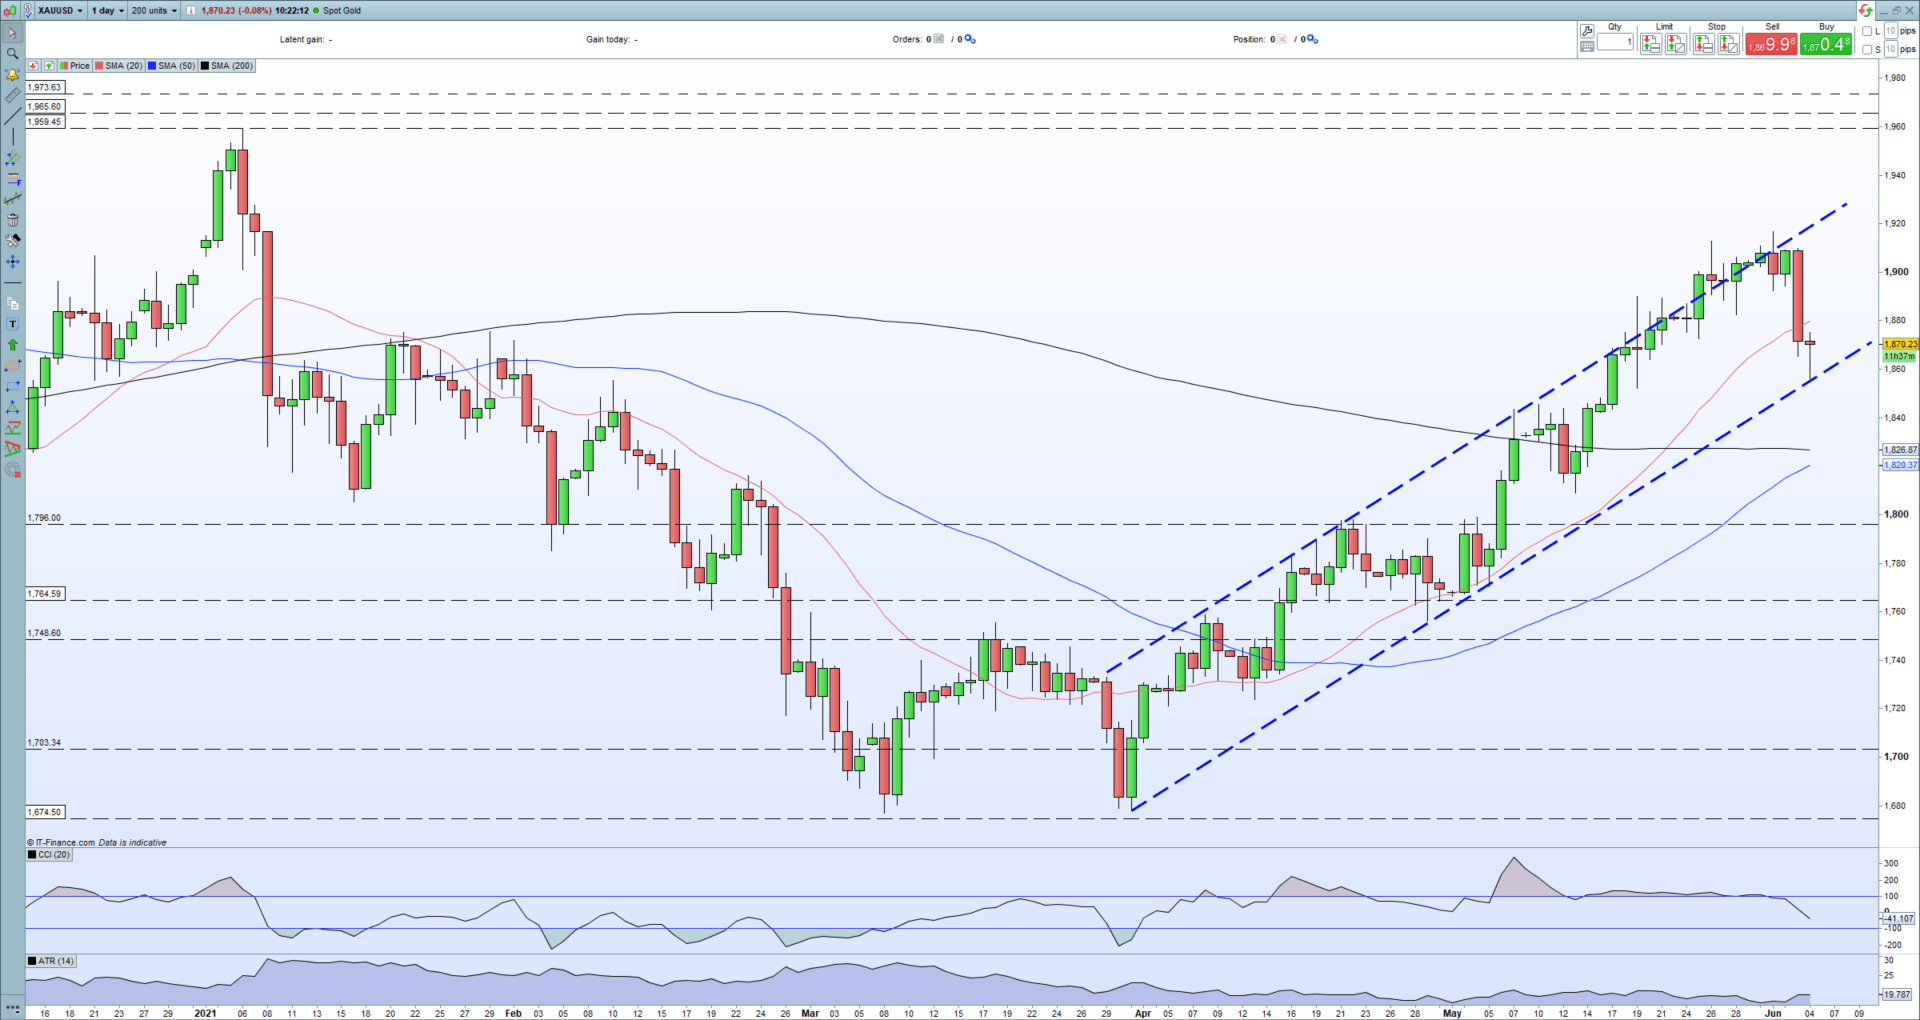
The multi-month bullish gold trend remains in place after yesterday’s USD rally sent the precious metal spinning lower. Trend support was tested for the first time in a month today, and duly held but the rebound looks tepid so far. The trend channel has held since late March/early April with resistance tested on numerous occasions, but not broken convincingly, but it looks likely that this support will come under further pressure after Thursday’s blow-out candle erased two weeks of gains.
On the economic calendar, all eyes will be on the latest US Jobs Report (NFP) today after Thursday’s robust ADP release showed hiring in the private sector picking up sharply. Last month’s NFP was a disappointment with just 266k new jobs created compared to market expectations in excess of 900k. The prior month’s (March) numbers were also revised sharply lower. Today’s jobs report will give us a better idea of the pace of the rebound in the US economy, and the ability of a wide range of companies to hire staff.
The daily chart highlights today’s test of support and the first time that gold has opened below the 20-day simple moving average since late March. If this short-dated sma remains dominant, gold may well test trend support at $1,855/oz. again. Retail traders remain heavily long of gold – see below – with short-positions pared back sharply both yesterday and over the last week.
Moving Average (MA) Explained for Traders
Gold Daily Price Chart (December 2020 – June 4, 2021)
| Change in | Longs | Shorts | OI |
| Daily | 4% | -3% | 0% |
| Weekly | 9% | -8% | 1% |
Client sentiment data show 79.87% of traders are net-long with the ratio of traders long to short at 3.97 to 1. The number of traders net-long is 0.20% higher than yesterday and 1.80% higher from last week, while the number of traders net-short is 29.95% lower than yesterday and 28.00% lower from last week.
We typically take a contrarian view to crowd sentiment, and the fact traders are net-long suggests Gold prices may continue to fall.Traders are further net-long than yesterday and last week, and the combination of current sentiment and recent changes gives us a stronger Gold-bearish contrarian trading bias.
What is Market Sentiment and How Does it Work?
What is your view on Gold – are you bullish or bearish?? You can let us know via the form at the end of this piece or you can contact the author via Twitter @nickcawley1.


