


Natural Gas, EIA, Exports, NOAA 8-14 Day Outlook – Talking Points
- Natural gas price supported by strong LNG export figures
- Weather, weekly EIA report seen as short-term price drivers
- September trendline in focus after second weekly price gain

Natural gas is on track to record a second weekly gain following bullish export figures from the US Energy Information Administration (EIA). US cross-border sales of liquefied natural gas (LNG) – the most common medium for transporting the commodity overseas -- hit a record high in March, according to data released by the EIA last week. March’s export figure was recorded at 317,678 million cubic feet (mcf).
The new record high comes after years of export growth in the heating gas, and that trend is expected to continue. However, per the last EIA short-term energy outlook released May 11, the US is expected to export 8.6 billion cubic feet per day (Bcf/d). This constitutes a drop from 9.2 Bcf/d in April. However, peak demand driven by strong demand in Asia and Europe is projected to increase to 9.0 Bcf/d through June and July. That bodes well for higher prices in the coming months.
EIA US Liquified Natural Gas Exports
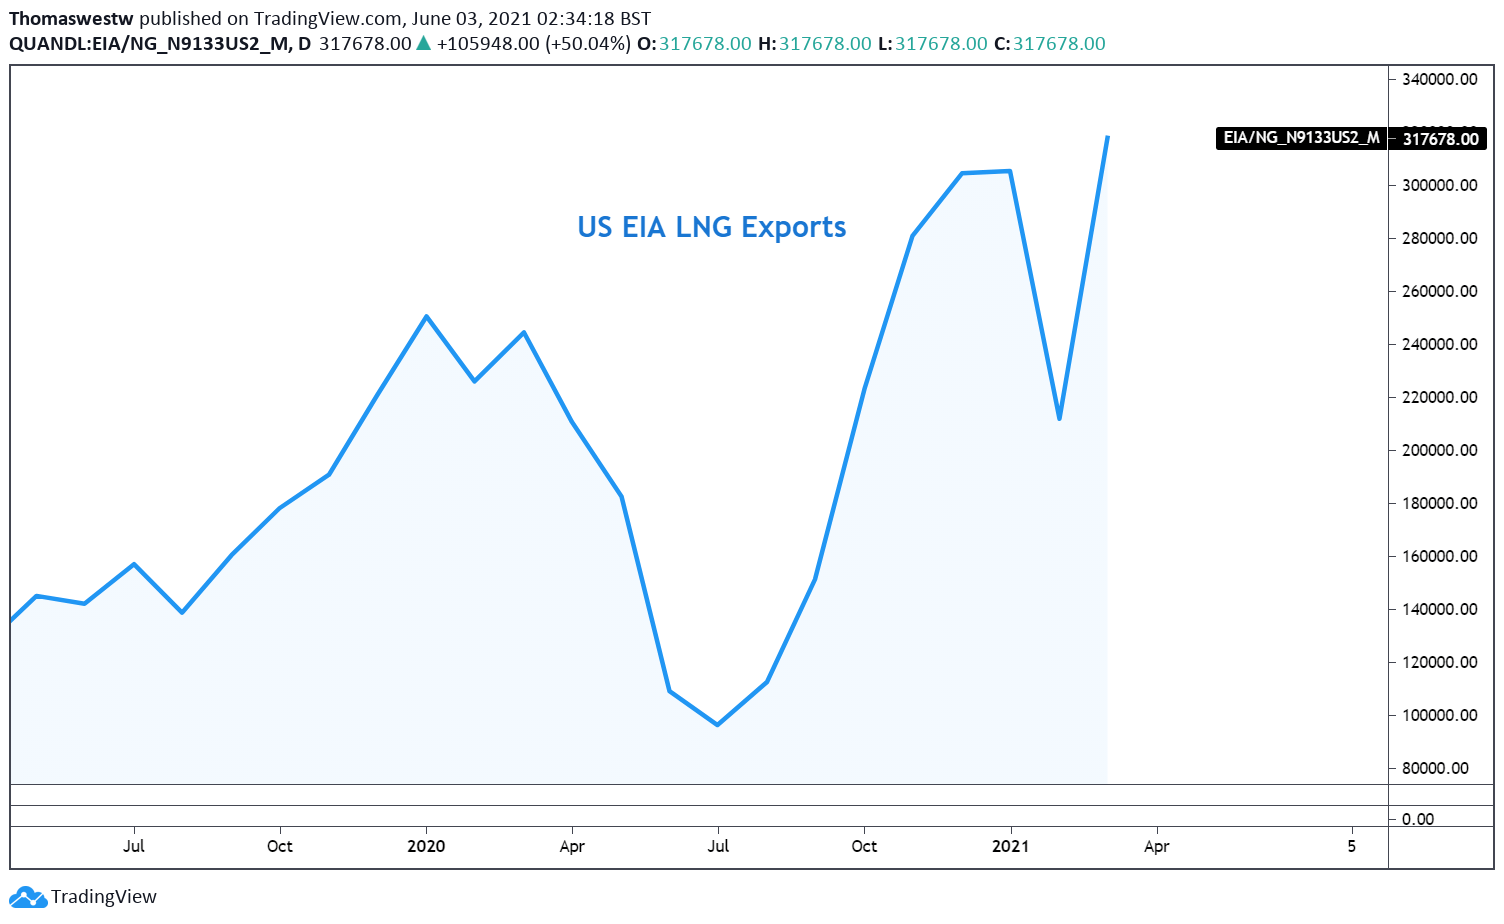
Chart created with TradingView
Still, shorter-term weather trends and storage reports may bring some volatility in the near term. The latest 8- to 14-day temperature probability forecast from the National Weather Service (NWS) shows an increased chance of higher-than-average temperatures across the Northern United States. On the other hand, Texas and the Florida panhandle may see below-average mercury readings (see chart below). Overall, the actual outcome looks to be a slightly bearish one, should the forecast turn out as expected.
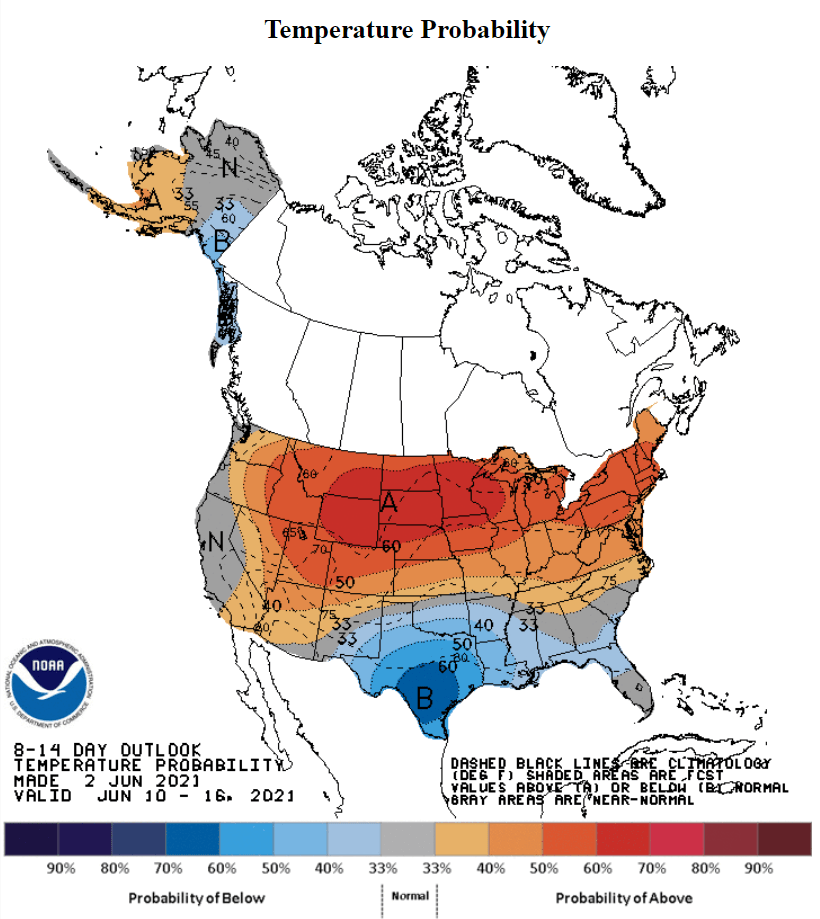
Source: noaa.gov
Instead, the EIA’s Weekly Natural Gas Storage Report could drive prices. Since we are in the injection season until October, a build in underground storage is typical. According to the DailyFX Economic Calendar, natural gas stocks for the week ending May 28 are expected to increase by 95 billion cubic feet. A smaller-than-expected build may help underpin prices.
Overall, prices may not see their next major move until the next LNG export report, which is due out at the end of the month. Any large surprises in inventory levels or unusual weather patterns may see volatile trading however. It is important to note underground storage levels are below the 5-year average, although they aren’t far off from that level (illustrated in the chart below).
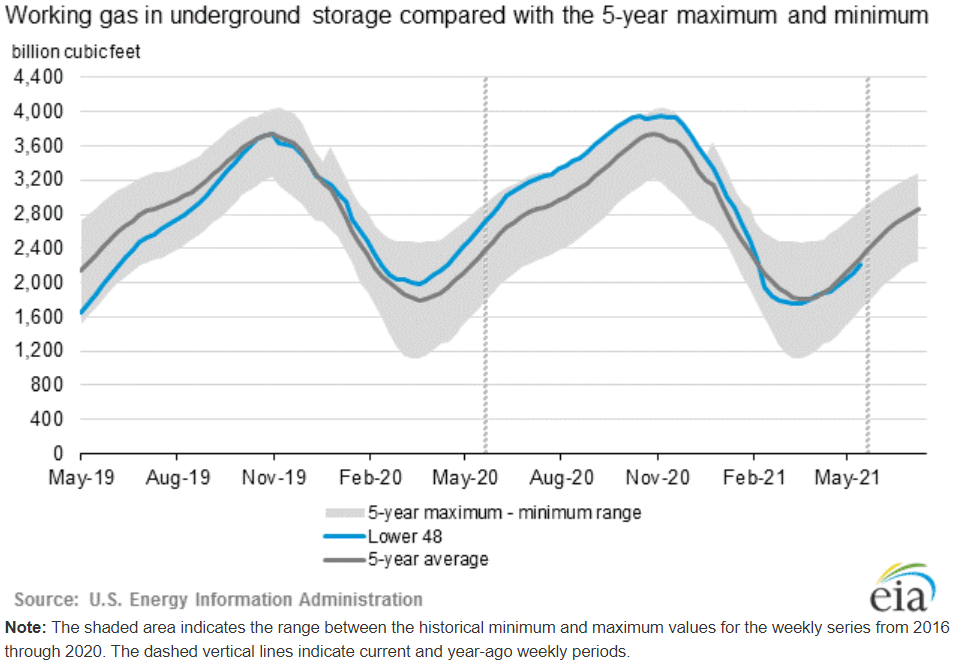
Source: eia.gov
Natural Gas Technical Forecast
Price appears to have stalled out after a run higher from the 2.832 swing low last week. The 23.6% Fibonacci retracement appears to be offering a level of resistance as the heating gas attempts to recapture a long-term trendline from the September swing low. Moving above the trendline will likely bring some bullish energy with it.
The May high at 3.150 will shift into focus above the trendline, followed by the 2021 high at 3.316. Above that lies the multi-year high at 3.396. To the downside, support may be found at the 38.2% Fib level. A break lower could see the 20-day Simple Moving Average (yellow line on chart) step in to provide support. Overall, the September trendline is the key technical barrier to watch (red channel on the chart below).
Natural Gas Daily Chart
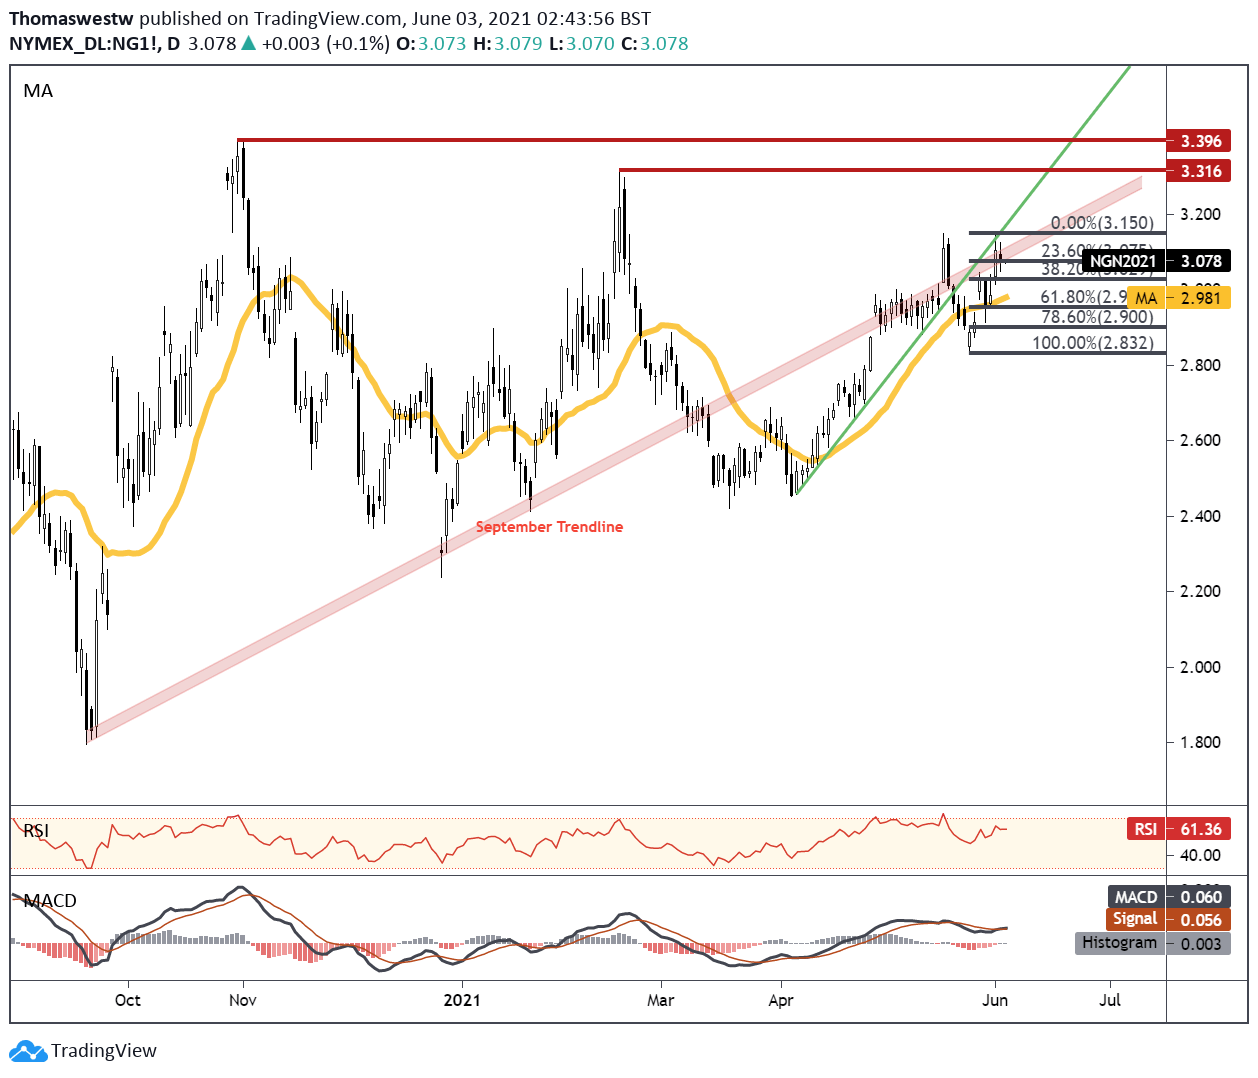
Chart created with TradingView
Natural Gas TRADING RESOURCES
- Just getting started? See our beginners’ guide for FX traders
- What is your trading personality? Take our quiz to find out
- Join a free webinar and have your trading questions answered
- Subscribe to the DailyFX Newsletter for weekly market updates
--- Written by Thomas Westwater, Analyst for DailyFX.com
To contact Thomas, use the comments section below or @FxWestwater on Twitter


