


XAU/USD Analysis:
- The precious metal continues its bullish rise amid inflation concerns
- Gold remains overbought, opening the door to a slow-down or retracement
- Fed policy stance, DXY, and real yields continue to drive the precious metal
Gold Continues to Shine as Inflation Concerns Mount
Commodities remain a hot topic in 2021 as the re-opening of the global economy has boosted demand for a number of commodities, most notably: oil, copper and gold. Although gold peaked back in 2020, the precious metal continues its bullish run after a decisive breakout above the multi-month descending channel, shown below.
Gold Weekly Chart: Long Term Trendline Intact
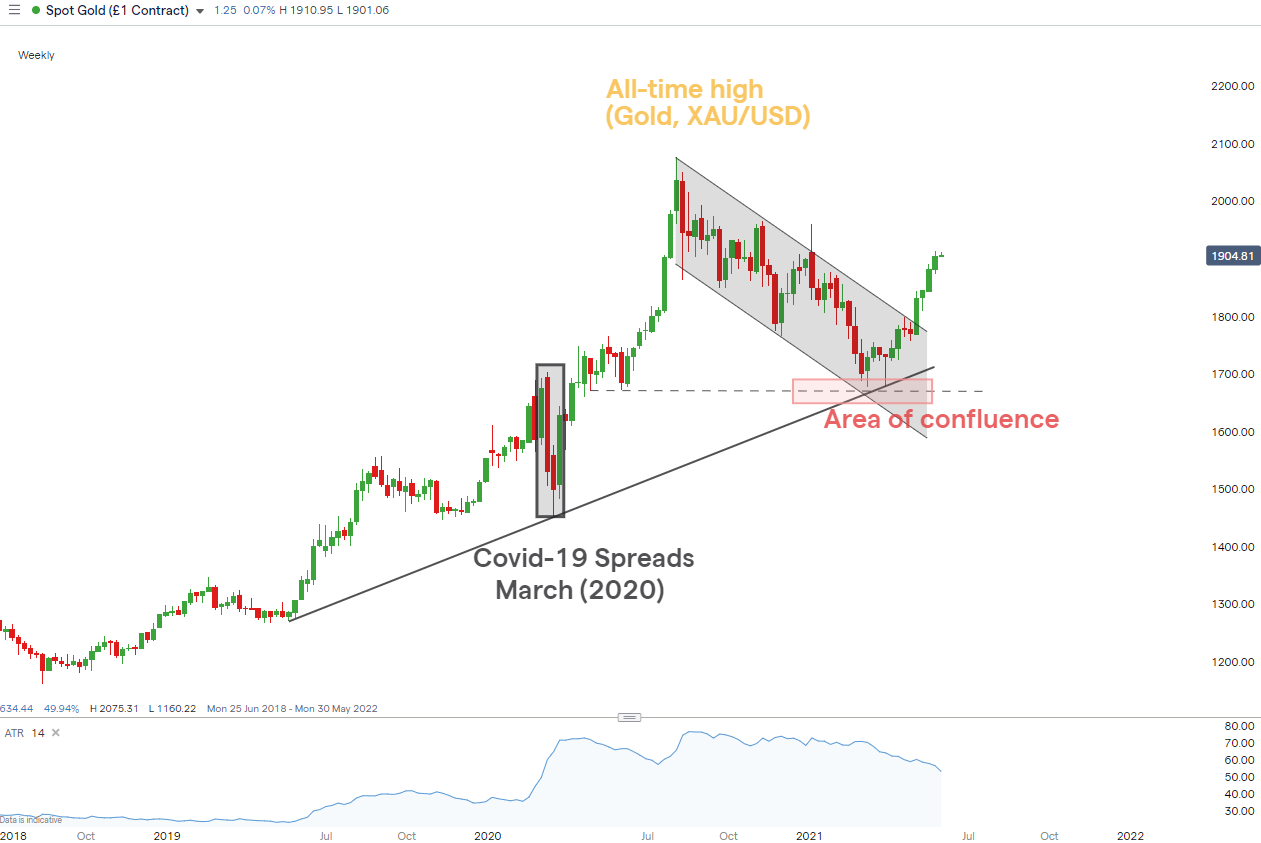
Chart prepared by Richard Snow, IG
However, gold’s appeal stretches beyond its industrial use as it is often sought after as a store of value, particularly in times of increasing inflation expectations.
Inflation Rears its Head Once More
Last week we saw greater than expected inflation in the form of the Core PCE Price Index which came in at 3.1% (2.9% expected), thus propelling the precious metal higher.

For all market-moving data releases and events see the DailyFX Economic Calendar
Gold (XAU/USD) Key Technical Levels
Gold trades between two fib levels (50% and 61.8%) which coincide with previous levels of resistance at 1880 and the 1920 – 1924 range. If the current bullish run is anything like the 2020 episode then a move above 1924 would certainly support this narrative – leaving the 1958 level as the next big hurdle.
However, the fact that gold has been overbought for two weeks opens the door to a short term pullback or even a period of consolidation before advancing higher. Adding to the possibility of a slow down in bullish momentum is the decreased inflows into the worlds largest gold ETF SPDR Gold Trust (GLD). It must be noted that although the fund saw increased inflows last week, the rate of inflows compared to the previous two weeks dropped significantly – suggestive of profit taking. For more on this see the full report from Margaret Yang.
A move toward 1880 could reignite interest in a bullish continuation play and would be the first real test to the bull run.
Daily Gold Chart
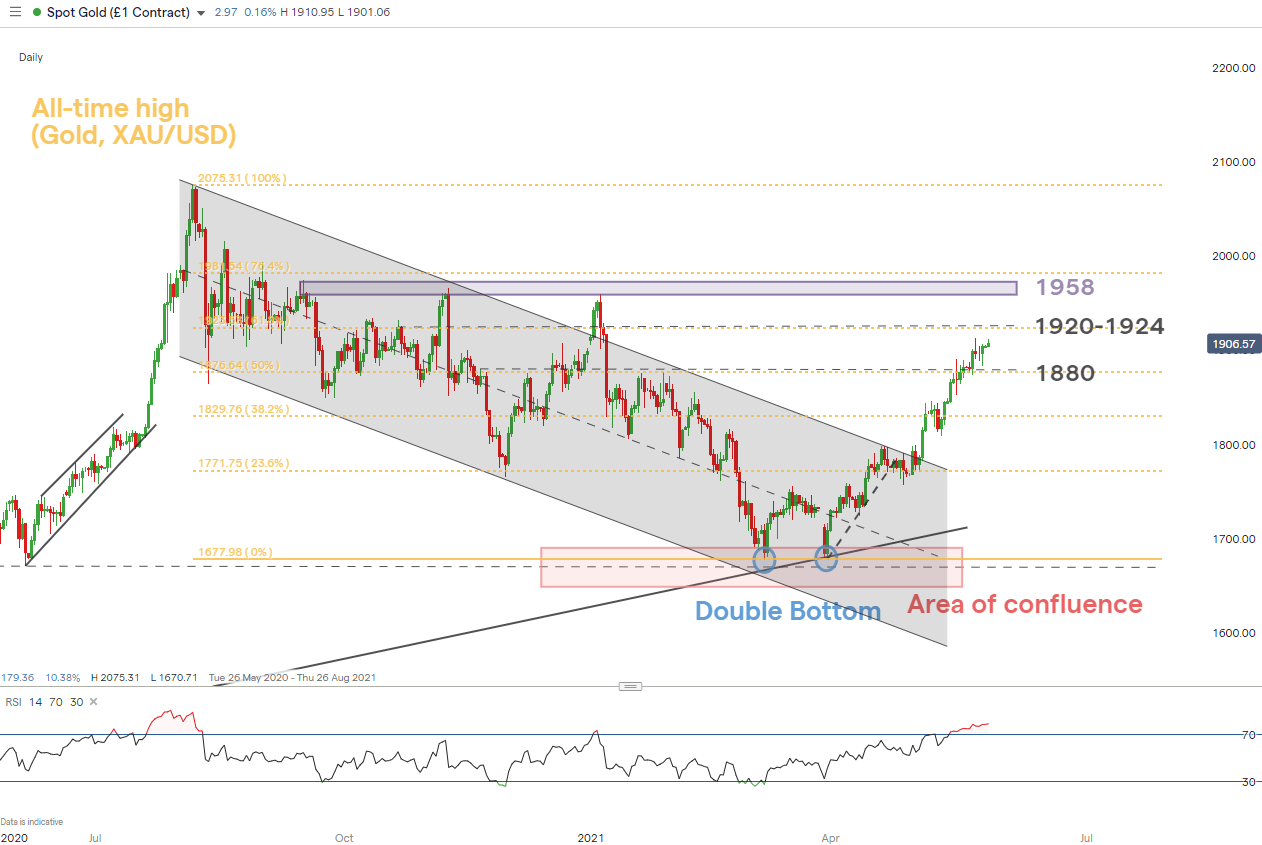
Chart prepared by Richard Snow, IG

Bullish Drivers Remain for Gold
Fed Policy and Real Yields
Fundamentally, gold remains attractive as the Federal Reserve has not yet sounded the alarm on inflation and is willing to endure levels of inflation above the targeted 2% for some time. The effect this has on lowering real yields remains favorable for gold.
Weakening US Dollar
The US dollar has weakened for most of the second quarter of 2021 and since gold is priced in USD, this makes gold relatively cheaper for non-US market participants. Gold may continue to benefit from this as long as the dollar remains suppressed.
--- Written by Richard Snow for DailyFX.com
Contact and follow Richard on Twitter: @RichardSnowFX


