


S&P 500, Hang Seng, ASX 200 INDEX OUTLOOK:
- Dow Jones, S&P 500 and Nasdaq 100 closed +0.41%, +0.12%, and -0.33% respectively
- Reddit day traders sent AMC Entertainment skyrocketing, boosting the Russell 2000 index
- The HSI and ASX 200 look set to open higher, setting a positive tone for APAC

Reddit-Fueled Rally, Jobless Claims, PCE Inflation, Asia-Pacific at Open:
Wall Street stocks were mixed on Thursday as traders mulled a stronger-than-expected jobless claims number alongside President Joe Biden’s additional federal spending plan. Jobless claims fell to 406k for the week ending 21st May, compared to a baseline forecast of 425k. This also marks the lowest reading since the pandemic, underscoring a healthy recovery in the labor market.
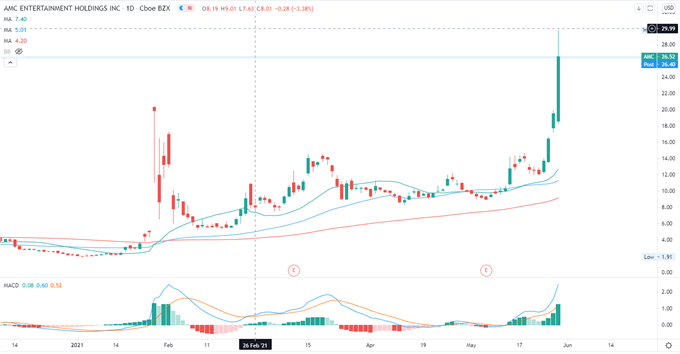
The Russell 2000 index surged over 1% as the return of Reddit-obsessed day traders fueled another round of speculative activity in the small- to mid-cap stocks. AMC Entertainment soared 35% on Thursday, marking a week-to-day gain of nearly 120%. The so-called ‘short squeeze’ strategy at play here aims to force call option sellers to cut losses quickly by buying back stocks in the market, resulting in an unusual rally in stock prices.
AMC Entertainment
The Nasdaq 100 index retreated 0.33% however, as rising longer-dated Treasury yields dented the appeal of the tech-centric benchmark. The 10-year rate climbed for a second day to 1.608%, as investors speculate that yields may have more room to go up with rising inflation and a widening fiscal deficit if the Biden administration can push through additional fiscal spending.
US 1Q GDP came largely in line with expectation at 6.4%, but durable goods orders missed forecasts by a wide margin. This is mainly due to a chip shortage that disrupted auto production.
Looking ahead, traders will keep a close eye on Friday’s core PCE inflation data for clues about rising price levels and their ramifications for the Fed’s policy outlook. The figure is expected to come in at 2.9% - the highest level since 1992 partly due to a low-base effect. Concerns surrounding inflation overshoot render the market vulnerable to heightened volatility if actual numbers deviate too far from baseline forecasts. Find out more from the DailyFX calendar.
US Core PCE Price Index (YoY) - Expectations
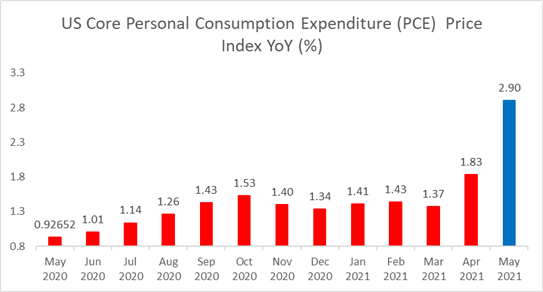
Source: Bloomberg, DailyFX
Asia-Pacific equities are positioned to open higher following a positive lead from Wall Street. Futures in Japan, mainland China, Australia, Hong Kong, Taiwan, Singapore and India are in the green.
Hong Kong’s Hang Seng Index (HSI) rebounded over the past two weeks, rising more than 5% since May 13th. Technology stocks were leading the gains, pushing the Hang Seng Tech Index 6.9% higher during the same period. MACD convergence hints at further upside potential for the index if it is able to breach above “Descending Channel” resistance formed since early March (chart below).
Hang Seng Tech Index
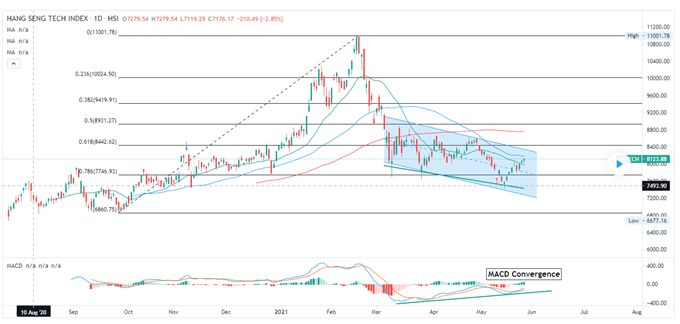
Chart by TradingView
Nasdaq 100 Index Technical Analysis
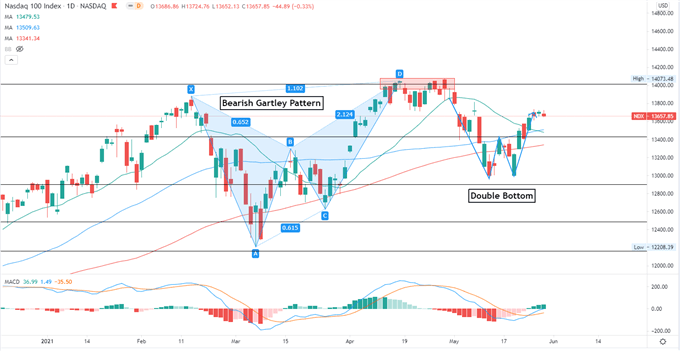
The Nasdaq 100 index has likely formed a minor “Double Bottom” pattern that is inherently bullish in nature. The pattern suggests that the index has found a near-term support at around 13,000 and may be positioned for further gains. An immediate support level can be found at 13,430 (the 161.8% extension), while a key resistance can be seen at 14,000 (200% Fibonacci extension). The MACD indicator formed a bullish crossover, suggesting that upward momentum is prevailing.
Nasdaq 100 Index – Daily Chart
Hang Seng Index Technical Analysis:
The Hang Seng Index (HSI) has likely formed a “Double Bottom” chart pattern on the daily chart and may be positioned for further price gains (chart below). The index breached above the trend-determine 100-day SMA line with upward momentum. An immediate resistance level can be found at 29,344 – the 50% Fibonacci retracement. Breaching above this level may open the door for further upside potential with an eye on 29,778 – the 38.2% Fibonacci retracement.
Hang Seng Index – Daily Chart
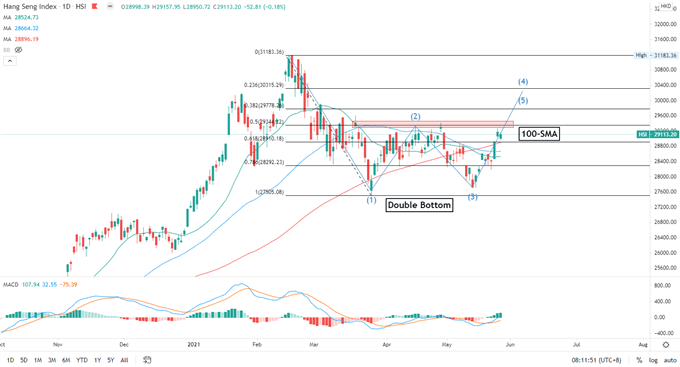
Chart by TradingView
ASX 200 Index Technical Analysis:
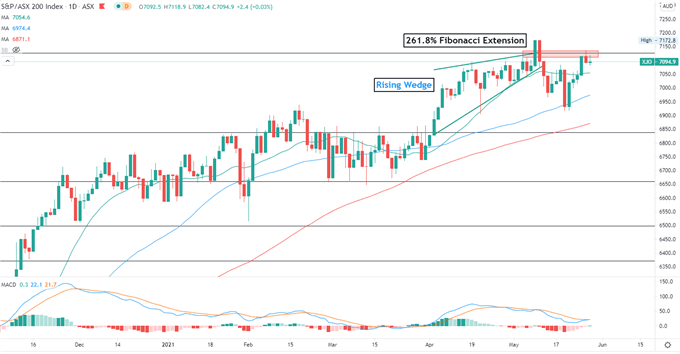
The ASX 200 index is facing a key resistance level at 7,126 (261.8% Fibonacci extension). Breaking this level will likely intensify near-term buying pressure and open the door for further upside potential toward 7,200. The MACD indicator is about to form a bullish crossover, suggesting that bullish momentum is building.
ASX 200 Index – Daily Chart

--- Written by Margaret Yang, Strategist for DailyFX.com
To contact Margaret, use the Comments section below or @margaretyjy on Twitter


