


Gold Price Forecast:
- Gold reversed at resistance near the $1,920 mark as rising Treasury yields undermined the metal
- Gold bulls will need to avoid further taper talk that could spark a USD rally and cripple gold gains
- Bitcoin vs Gold: Top Differences Traders Should Know
Gold Price Reverses at Resistance as Rally Remains Intact
Gold reversed at resistance late this week after the metal tagged its highest price since early January on Tuesday. Gold’s price gains have seen it extend beyond the upper bound of the descending channel from August and add to its rally that began in early April when gold traded beneath $1,700. Now with the downtrend broken, gold may look to continue higher should fundamental forces allow.
Gold & US Treasury Yield Price Chart: Daily Time Frame (January 2019 - May 2021)
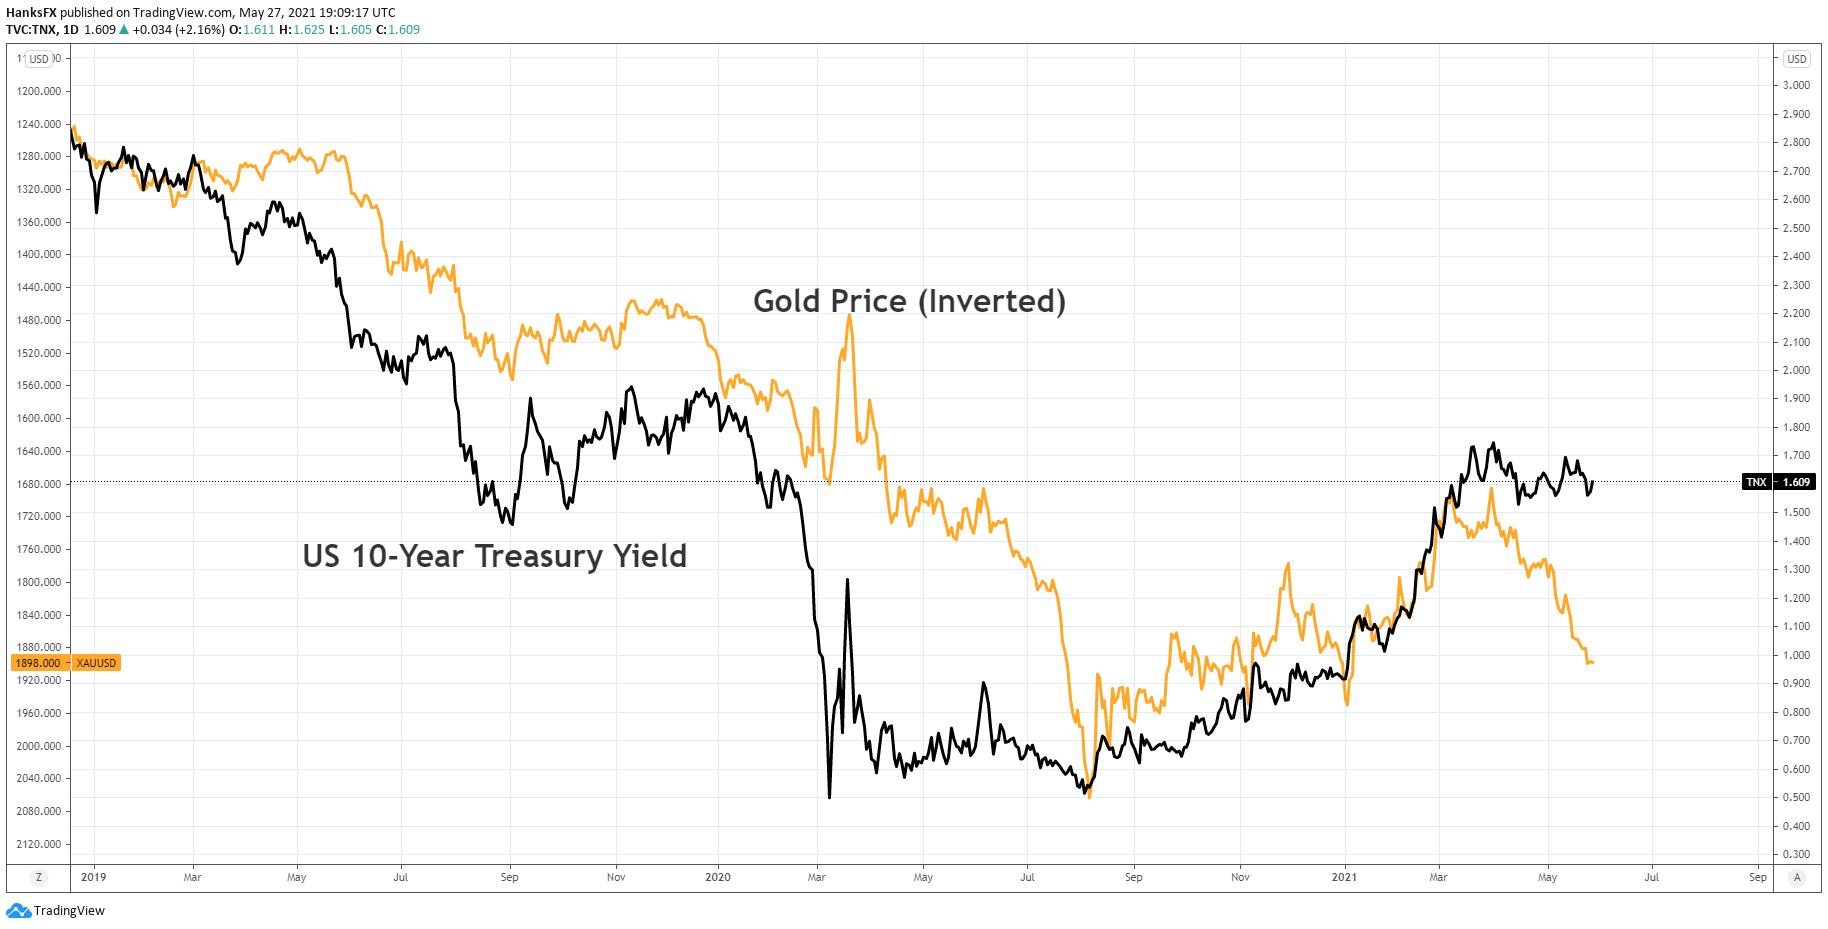
While the medium term outlook for gold is encouraging, strength in US Treasurys could erode the metal’s standing and spark a quick reversal lower. The two markets share a strong negative correlation, as shown above, and gold’s gains have been established while US Treasury yields have floated between the 1.70% and 1.50% levels. Should the range in yields break in either direction, gold may experience heightened volatility.
Gold Price Surges to Highest Level Since January, Can it Continue?
With that in mind, gold traders should continue to keep a close eye on yield movements as they likely hold the key to upcoming price action. Regardless of the fundamental landscape and market sentiment conditions, the technical outlook of XAU/USD is encouraging despite the recent retreat from resistance.
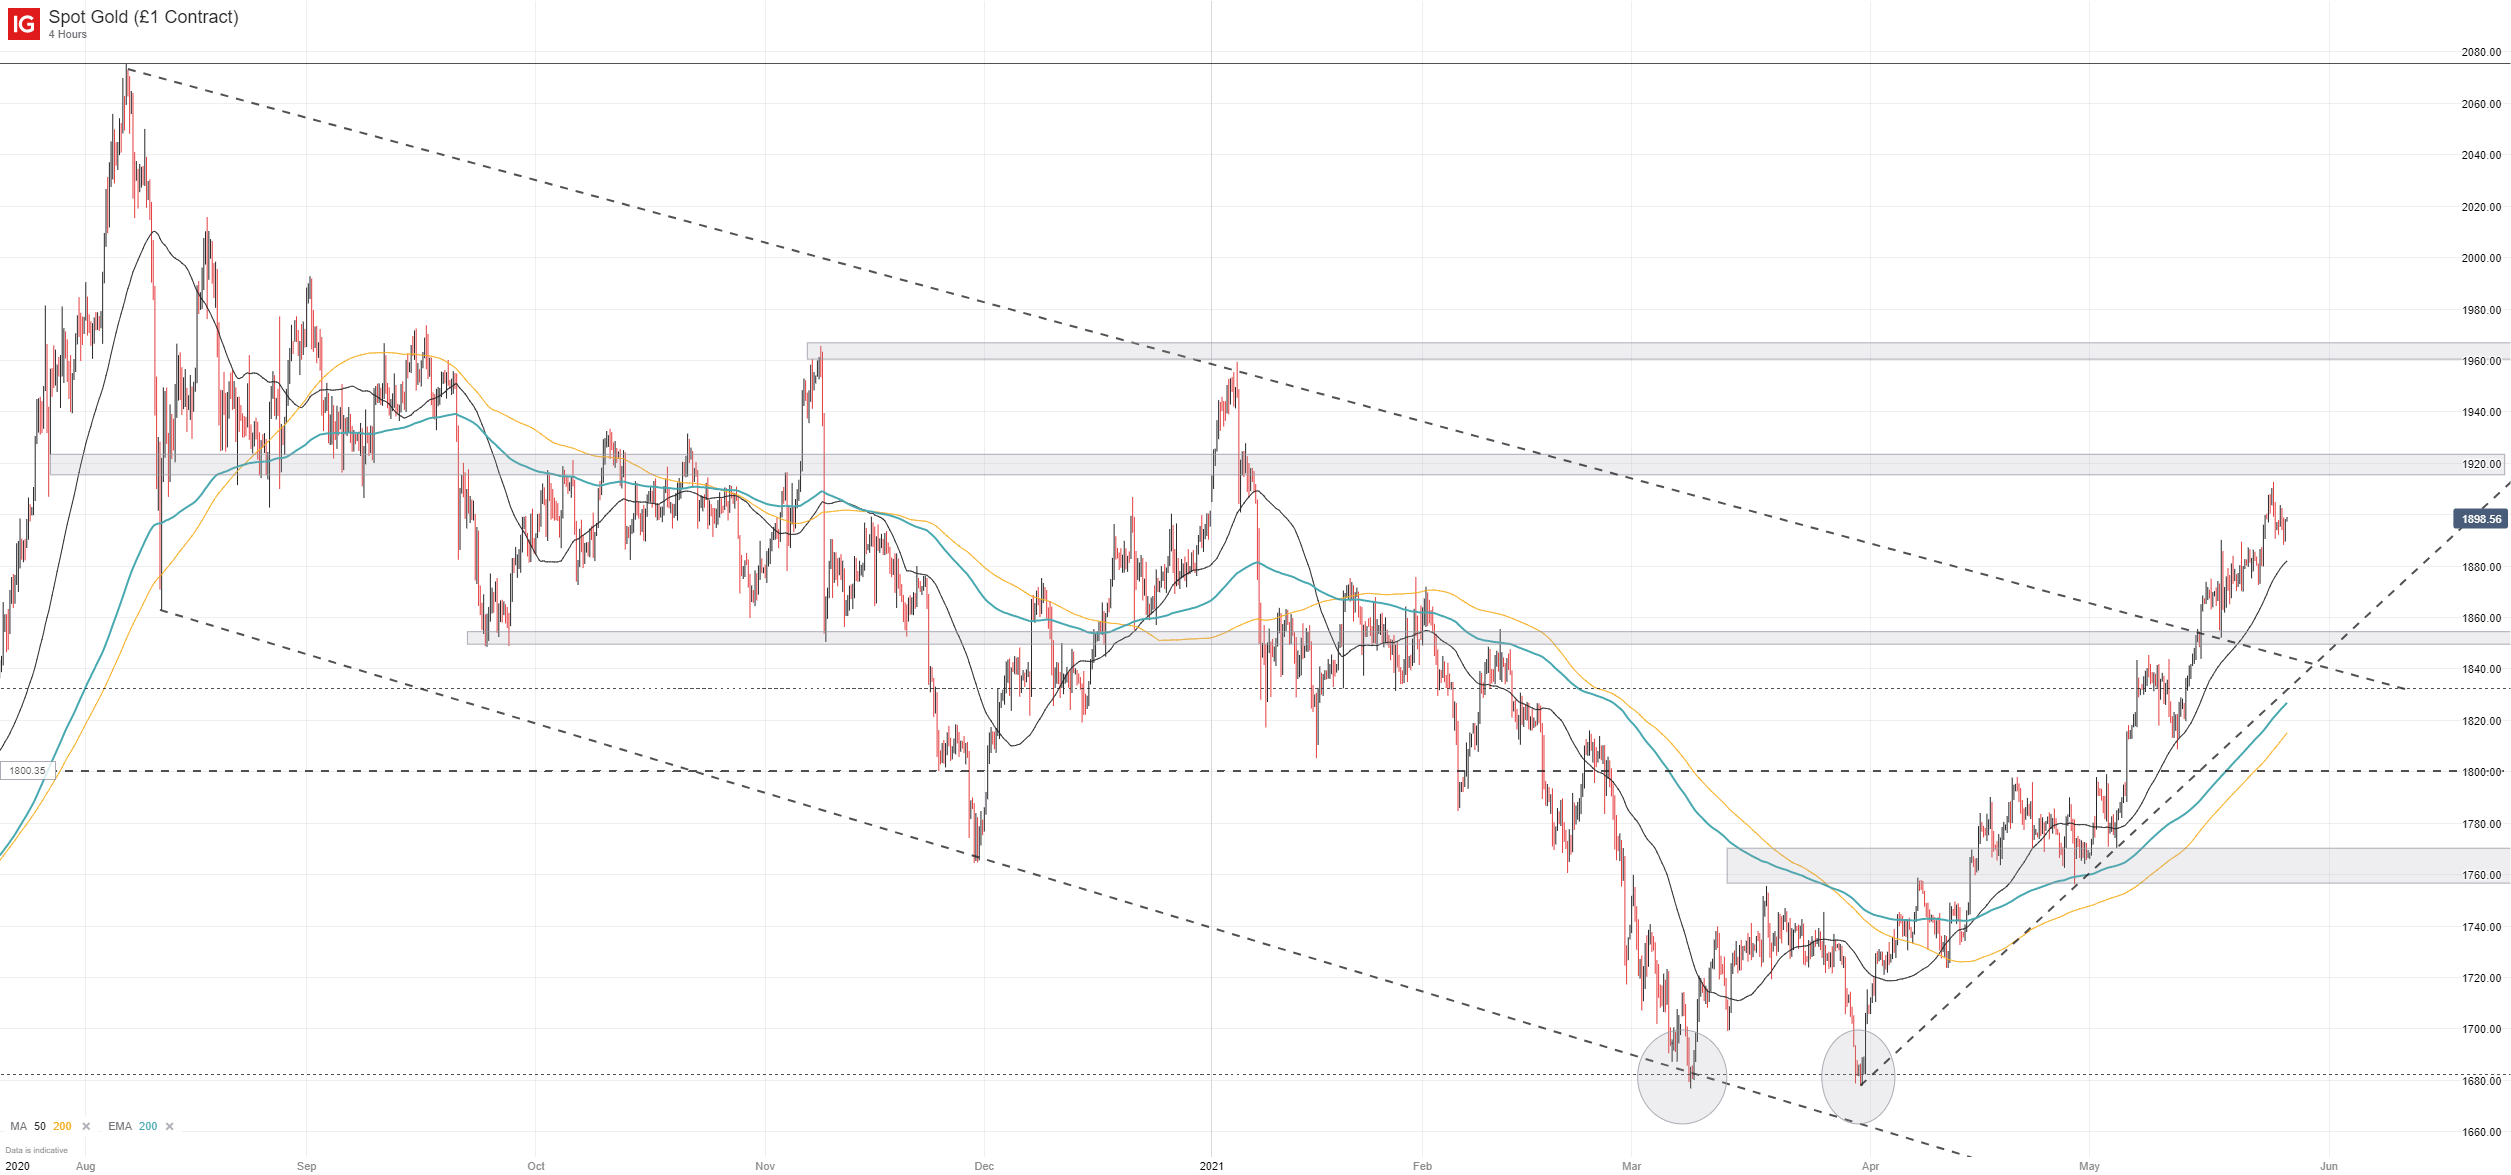
Gold (XAU/USD) Price Chart: 4 – Hour Time Frame (August 2020 - May 2021)
How to Trade Gold: Top Gold Trading Strategies and Tips
The resistance in question resides around the $1,920 mark, although secondary resistance around $1,960-65 is likely the more formidable zone. Beyond the two levels resistance becomes rather sparse until the metal’s all-time high just shy of $2,080.

Unlike much of the August downtrend, gold now has weeks of gains behind it that may create supportive zones beneath in the event of a reversal lower. Such a reversal would likely materialize at the hands of a fundamental shift.
Early support resides along the upper-bound of the descending channel and around the $1,850 mark. Either way, gold looks to be in the midst of a bullish breakout which could see further topside progress in the days ahead. Shorter-term pullbacks like the one experienced toward the tail end of this week may serve as healthy consolidation as bulls reload to push higher. In the meantime, follow @PeterHanksFX on Twitter for updates and analysis.
--Written by Peter Hanks, Strategist for DailyFX.com
Contact and follow Peter on Twitter @PeterHanksFX


