.jpg)

Euro Technical Outlook:
- EUR/USD momentum fade threatens a bearish support break
- EUR/CHF continues lower with eyes on former triangle resistance
EUR/USD Technical Outlook
The Euro has been declining versus the US Dollar since hitting a multi-month high earlier this week, reaching 1.2266. Still, EUR/USD is on track to record a monthly gain of over 1% as May wraps up over the next few days.
However, the currency pair is now grinding against trendline support set from the monthly swing low. Thisbarrier (green line on chart) will have to hold to preserve the broader trend higher. A break lower threatens the larger rally, but the 20-day Simple Moving Average may step in to provide intermediate support. To the upside, EUR/USD’s 23.6% Fibonacci level may offer resistance on its way to potentially challenge the 1.2266 May swing high.
EUR/USD Daily Chart
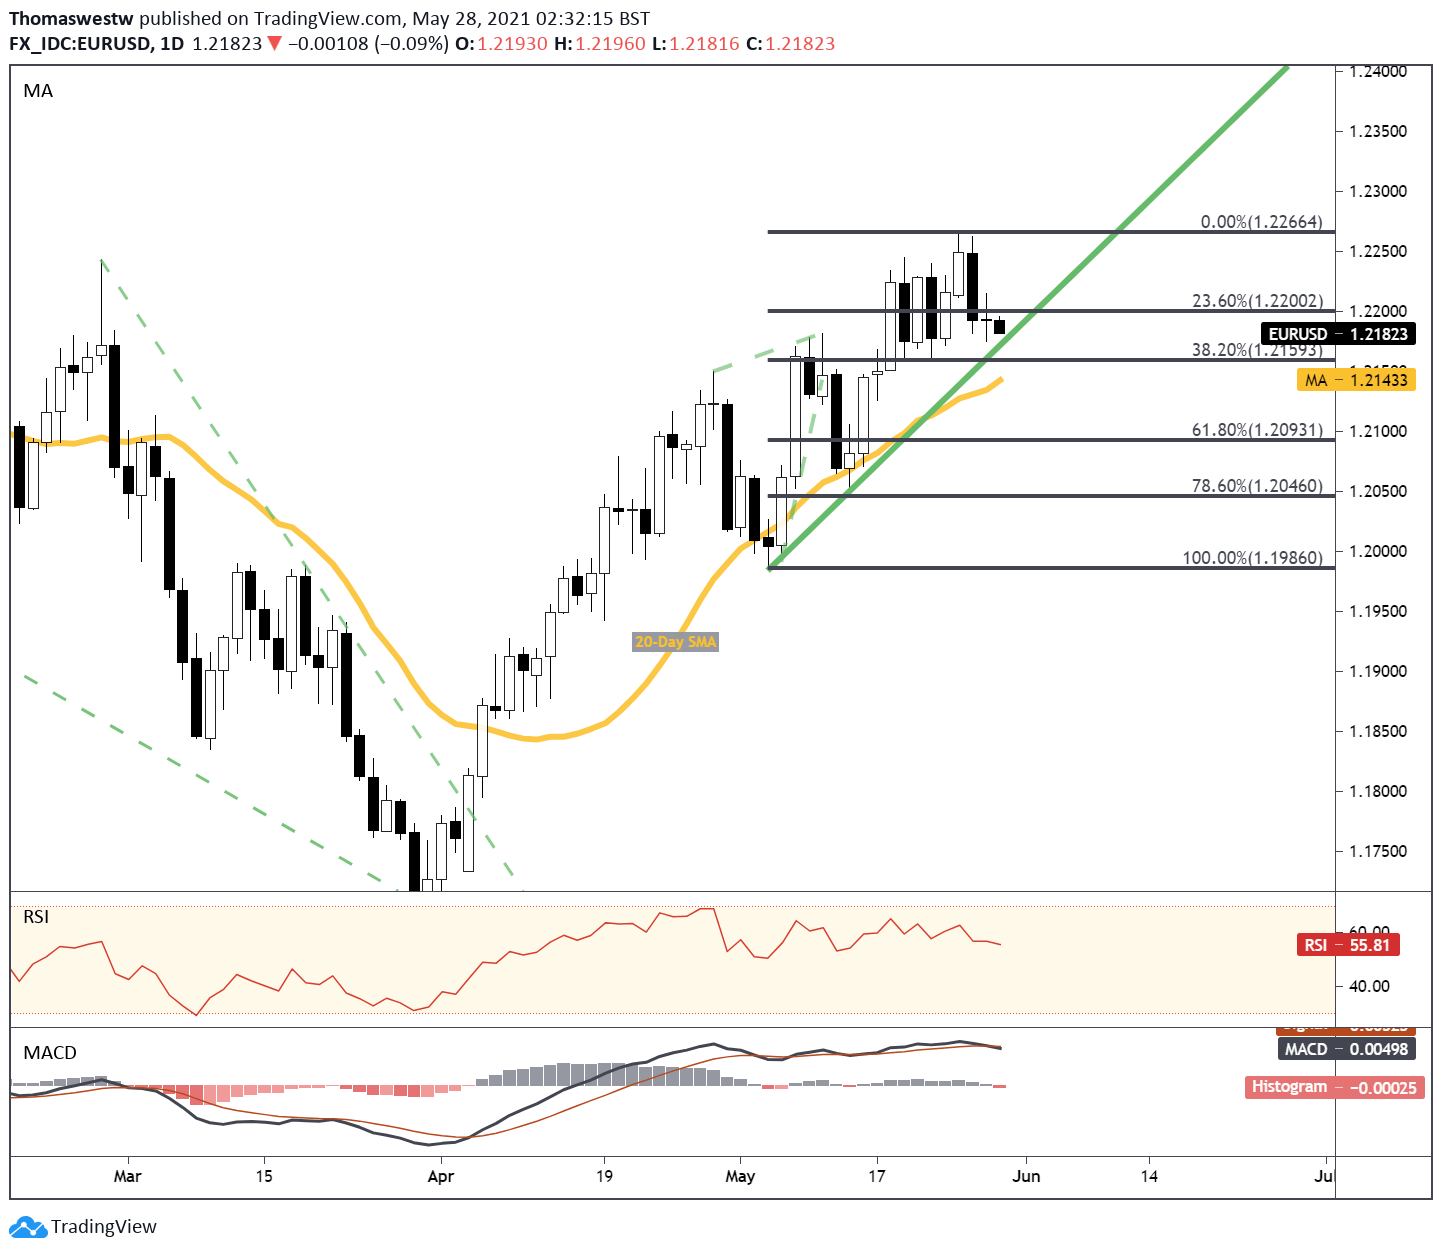
Chart created with TradingView

EUR/CHF Technical Outlook
The Euro has ceded ground to the Swiss Franc this month, extending losses from April when EUR/CHF put in a 0.83% drop. Price pierced below the recently supportive 100-day SMA (purple line on chart). Selling pressure has dragged the 20- and 50-day SMA’s (yellow and blue lines) lower, and a cross between the 20- and 100-day looks set to occur in the short term to mark a bearish signal.
With that in mind, further downside may be the most likely path forward. If so, the upper bound of a Rising Triangle may offer a supportive floor.Trendline support stemming from the triangle pattern floor may also help. Alternatively, a move higher could run into technical interference from the aforesaid moving averages.
EUR/CHF Daily Chart
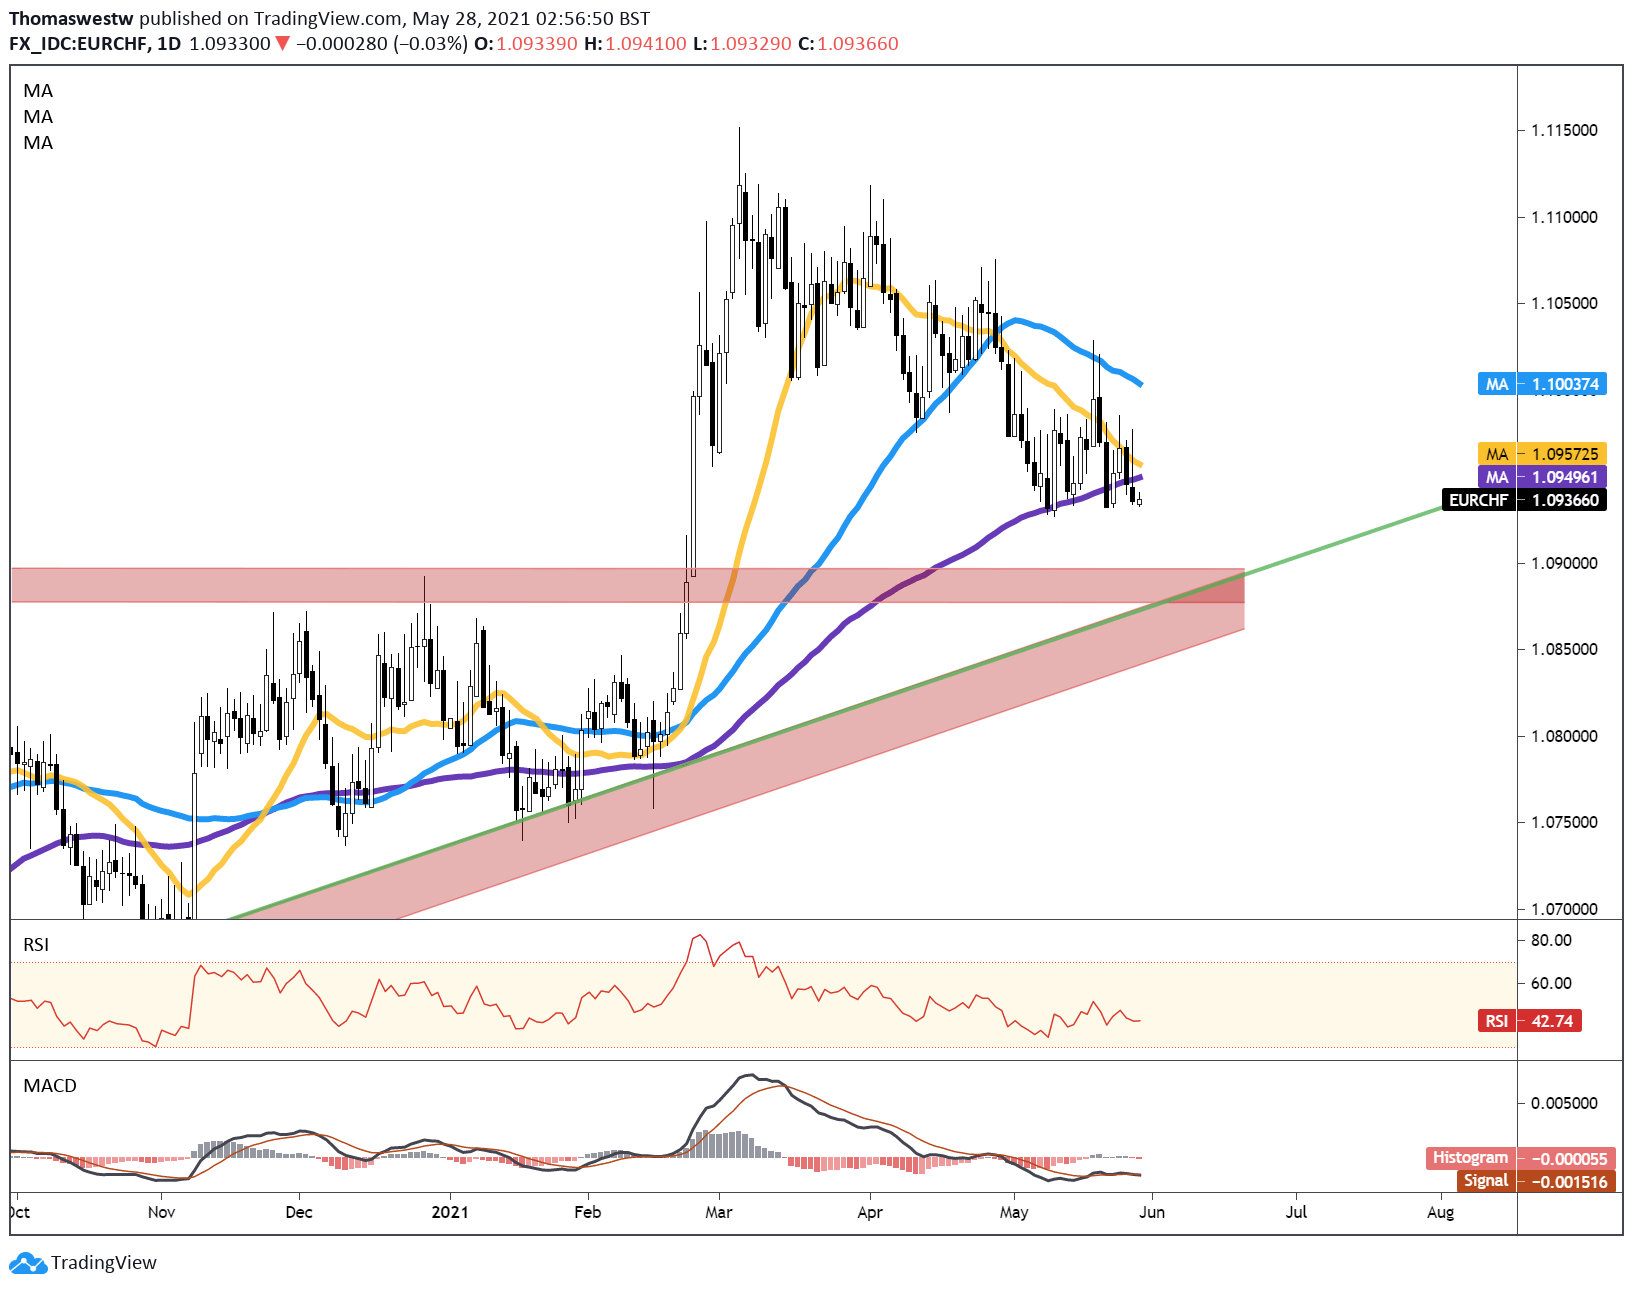
Chart created with TradingView
EURO TRADING RESOURCES
- Just getting started? See our beginners’ guide for FX traders
- What is your trading personality? Take our quiz to find out
- Join a free webinar and have your trading questions answered
- Subscribe to the DailyFX Newsletter for weekly market updates
--- Written by Thomas Westwater, Analyst for DailyFX.com
To contact Thomas, use the comments section below or @FxWestwater on Twitter