


Gold (XAU/USD) Analysis, Price and Chart
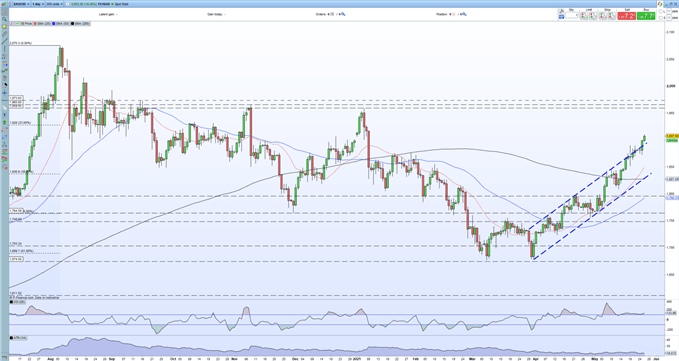
- Multi-week bullish channel breakout
- A close above $1,900/oz. should leave the way open to $1,960/oz.

The multi-month bullish gold trend continues apace and the latest break higher has seen both the psychological $1,900/oz. level and channel resistance broken. We noted last week that trend resistance was under pressure and today’s move needs to be consolidated to re-affirm the positive nature of the market.
Gold Price Technical Outlook – Looking at a Topside Break of The Bullish Channel
The price targets remain the same with the 23.6% Fibonacci retracement of last year’s March-August rally situated at $1,928/oz. ahead of a cluster of prior highs starting at $1,960/oz. The bullish sentiment is given extra credibility by the recent positive cross-over of the 20- and 200-day simple moving averages, while the yield on the 10-year UST has fallen back to a near range-low of 1.57% as US inflation fears recede, for now anyway.
Moving Average (MA) Explained for Traders
On the economic calendar, there are a few data releases to note that may move the US dollar and gold. The second look at US Q1 GDP and durable goods orders for April will be released on Thursday, while on Friday the Fed’s preferred measure of inflation, core PCE, will hit the screens at 12:30 BST.
Gold Daily Price Chart (July 2020 – May 25, 2021)
| Change in | Longs | Shorts | OI |
| Daily | 7% | -5% | 1% |
| Weekly | 11% | -9% | 1% |
Client sentiment data show 71.89% of traders are net-long with the ratio of traders long to short at 2.56 to 1.The number of traders net-long is 2.68% lower than yesterday and 4.26% lower from last week, while the number of traders net-short is 8.08% higher than yesterday and 2.77% lower from last week.
We typically take a contrarian view to crowd sentiment, and the fact traders are net-long suggests Gold prices may continue to fall.Yet traders are less net-long than yesterday and compared with last week. Recent changes in sentiment warn that the current Gold price trend may soon reverse higher despite the fact traders remain net-long.
What is Market Sentiment and How Does it Work?
What is your view on Gold – are you bullish or bearish?? You can let us know via the form at the end of this piece or you can contact the author via Twitter @nickcawley1.


