


CRUDE OIL PRICE FORECAST: TECHNICAL STRENGTH MIRED BY IRAN NUCLEAR DEAL, ASIA’S COVID CRISIS
- Crude oil prices popped nearly 4% on Monday to test the upper end of its recent range
- Eclipsing the $68.00-price level could see the commodity take aim at its 2018 swing high
- Iran nuclear deal and covid concerns across Asia pose headwinds to crude oil outlook
- Learn about WTI vs Brent or visit our education center for insight on technical analysis
Crude oil price action spiked higher on Monday to trade around $66.00/bbl. This pushed the commodity back to the upper end of its recent trading range, which has largely capped WTI since 08 March. I’ve had this technical resistance level highlighted on my charts for a while and even pointed out potential for crude oil prices to edge lower toward trend support. As expected, WTI crude oil did pull back from this level, and bulls have been showing up to defend the 50-day simple moving average. Crude oil price action has now gained roughly 7% over the last two trading sessions. This is threatening a breakout as the MACD oscillator starts to form a bullish crossover.

CRUDE OIL PRICE CHART: DAILY TIME FRAME (28 DEC 2020 TO 24 MAY 2021)
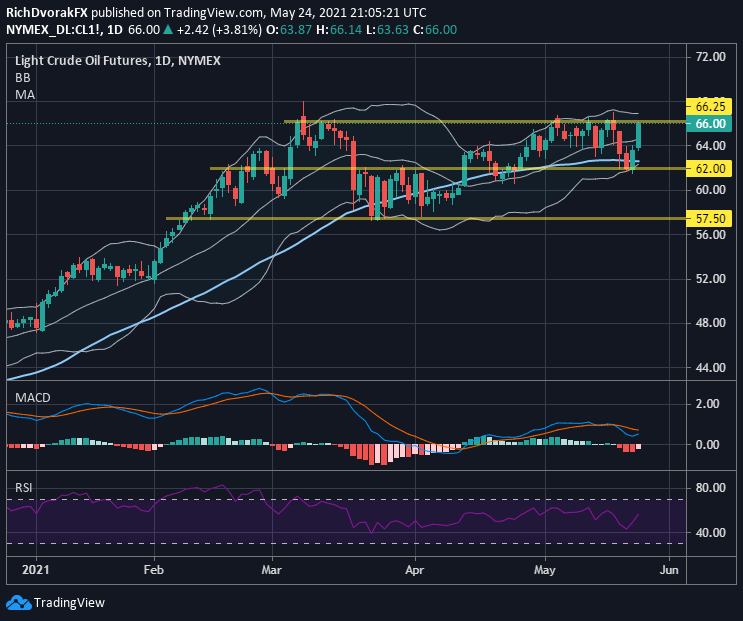
Chart by @RichDvorakFX created using TradingView
WTI crude oil prices might head toward 2018 swing highs near $75.00/bbl if the commodity can notch a close above $66.25/bbl and invalidate this technical barrier. Breakout confirmation could be provided by eclipsing the 08 March high and greater conviction may be warranted with an accompanying Bollinger Band expansion. That said, in light of risks to outlook surrounding an Iran nuclear deal and mounting covid concerns across Asia, there is noteworthy potential for crude oil price action to snap back lower. This could leave the commodity stuck within its recent range.
| Change in | Longs | Shorts | OI |
| Daily | -2% | -7% | -3% |
| Weekly | 20% | -25% | 3% |
-- Written by Rich Dvorak, Analyst for DailyFX.com
Connect with @RichDvorakFX on Twitter for real-time market insight


