


GBP/USD Analysis:
- Positive Jobs data incapable of ushering GBP/USD to new yearly high
- GBP/USD continues 14-month bullish run despite bearish engulfing candle
- Mixed sentiment reading hints that the pullback may continue
UK Jobs Data and Inflation Figures Produce Opposite Effects
The UK jobs data released on Tuesday was welcomed and buoyed GBP/USD. The figure of 84k new jobs beat expectations of 50k, while unemployment data showed a lower than expected figure, coming in at 4.8% vs 4.9%.
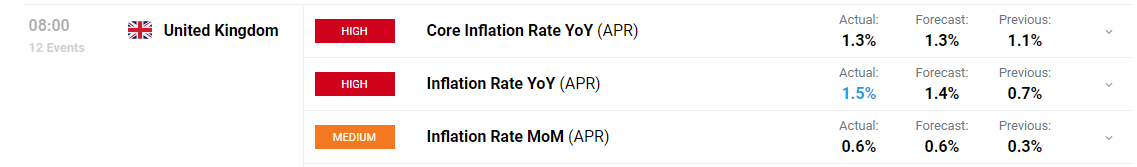
However, yesterday’s UK inflation data raised concerns, mainly around the pace of future inflation, as the UK enters the next stage of re-opening – which is likely to see increased travel and greater economic activity in previously restrained sectors particularly restaurants and pubs.
Next up on the calendar to round off this week is the Markit PMIs due to be released on Friday. For all market-moving data releases and events see the DailyFX Economic Calendar
GBP/USD Technicals: Bearish Engulfing Candle Provides Basis for Brief Pullback
After the release of the UK inflation data and on the back of the FOMC minutes, GBP/USD witnessed a modest sell-off just as the yearly highs were in sight. The appearance of a bearish engulfing candle on the daily chart suggests that the pullback may still have some room to move with the former resistance zone of 1.4000 providing the next level of support. Bulls may look to this level to provide insight into a possible bullish continuation play, using the zone of support as a launchpad.
Learn what the bearish engulfing candlestick means for FX markets and how to identify it by reading our article: Trading with the Bearish Engulfing Candle
Image: Bearish Engulfing Candle

Should buyers overwhelm sellers in the near future, the yearly high around 1.4240 still presents quite a challenge. A break and hold above the high may suggest even further bullish momentum, highlighting the previous (2018) high of around of 1.4360 which comes into play.
GBP/USD Daily Chart

Chart prepared by Richard Snow, IG

Mixed Sentiment Reading Suggests Caution
| Change in | Longs | Shorts | OI |
| Daily | 2% | -5% | 0% |
| Weekly | 6% | 4% | 5% |
- GBP/USD: Retail trader data shows 37.65% of traders are net-long with the ratio of traders short to long at 1.66 to 1
- Yet traders are less net-short than yesterday and compared with last week.
- The number of traders net-long is 0.28% higher than yesterday and 7.04% higher from last week, while the number of traders net-short is 15.85% lower than yesterday and 4.55% lower from last week.
- Recent changes in sentiment warn that the current GBP/USD price trend may soon reverse lower despite the fact traders remain net-short.
--- Written by Richard Snow for DailyFX.com
Contact and follow Richard on Twitter: @RichardSnowFX


