


Gold Price Forecast:
- Gold remains locked in a descending channel but price has begun to recover and could break higher
- A bullish MACD crossover has occurred on the weekly price chart which could suggest gains ahead
- Bitcoin vs Gold: Top Differences Traders Should Know
Gold Price Forecast: Can Gold Stage a Major Breakout?
Gold jumped to its highest price since February this week as it moved to test the topside of a longstanding downtrend. While the precious metal has bled lower since August, a recent uptick in inflationary fears amid white-hot data prints and encouraging technical patterns may look to drive the commodity higher in the weeks ahead.
That said, gold has climbed almost continuously since the formation of the recent double bottom pattern and may require consolidation before it can look to breakout in earnest. Thankfully for bulls, weeks of gains have seen the metal overtake resistance, all of which may serve as support going forward.
Gold (XAU/USD) Price Chart: 4 - Hour Time Frame (July 2020 - May 2021)

Initial buoyance in the event of a downturn may reside near the $1800 mark and nearby rising trendline, followed by secondary support near the $1765 area. The zones should look to ward of deeper declines and allow gold attempt an extension higher. That said, the technical outlook for gold is highly encouraging.
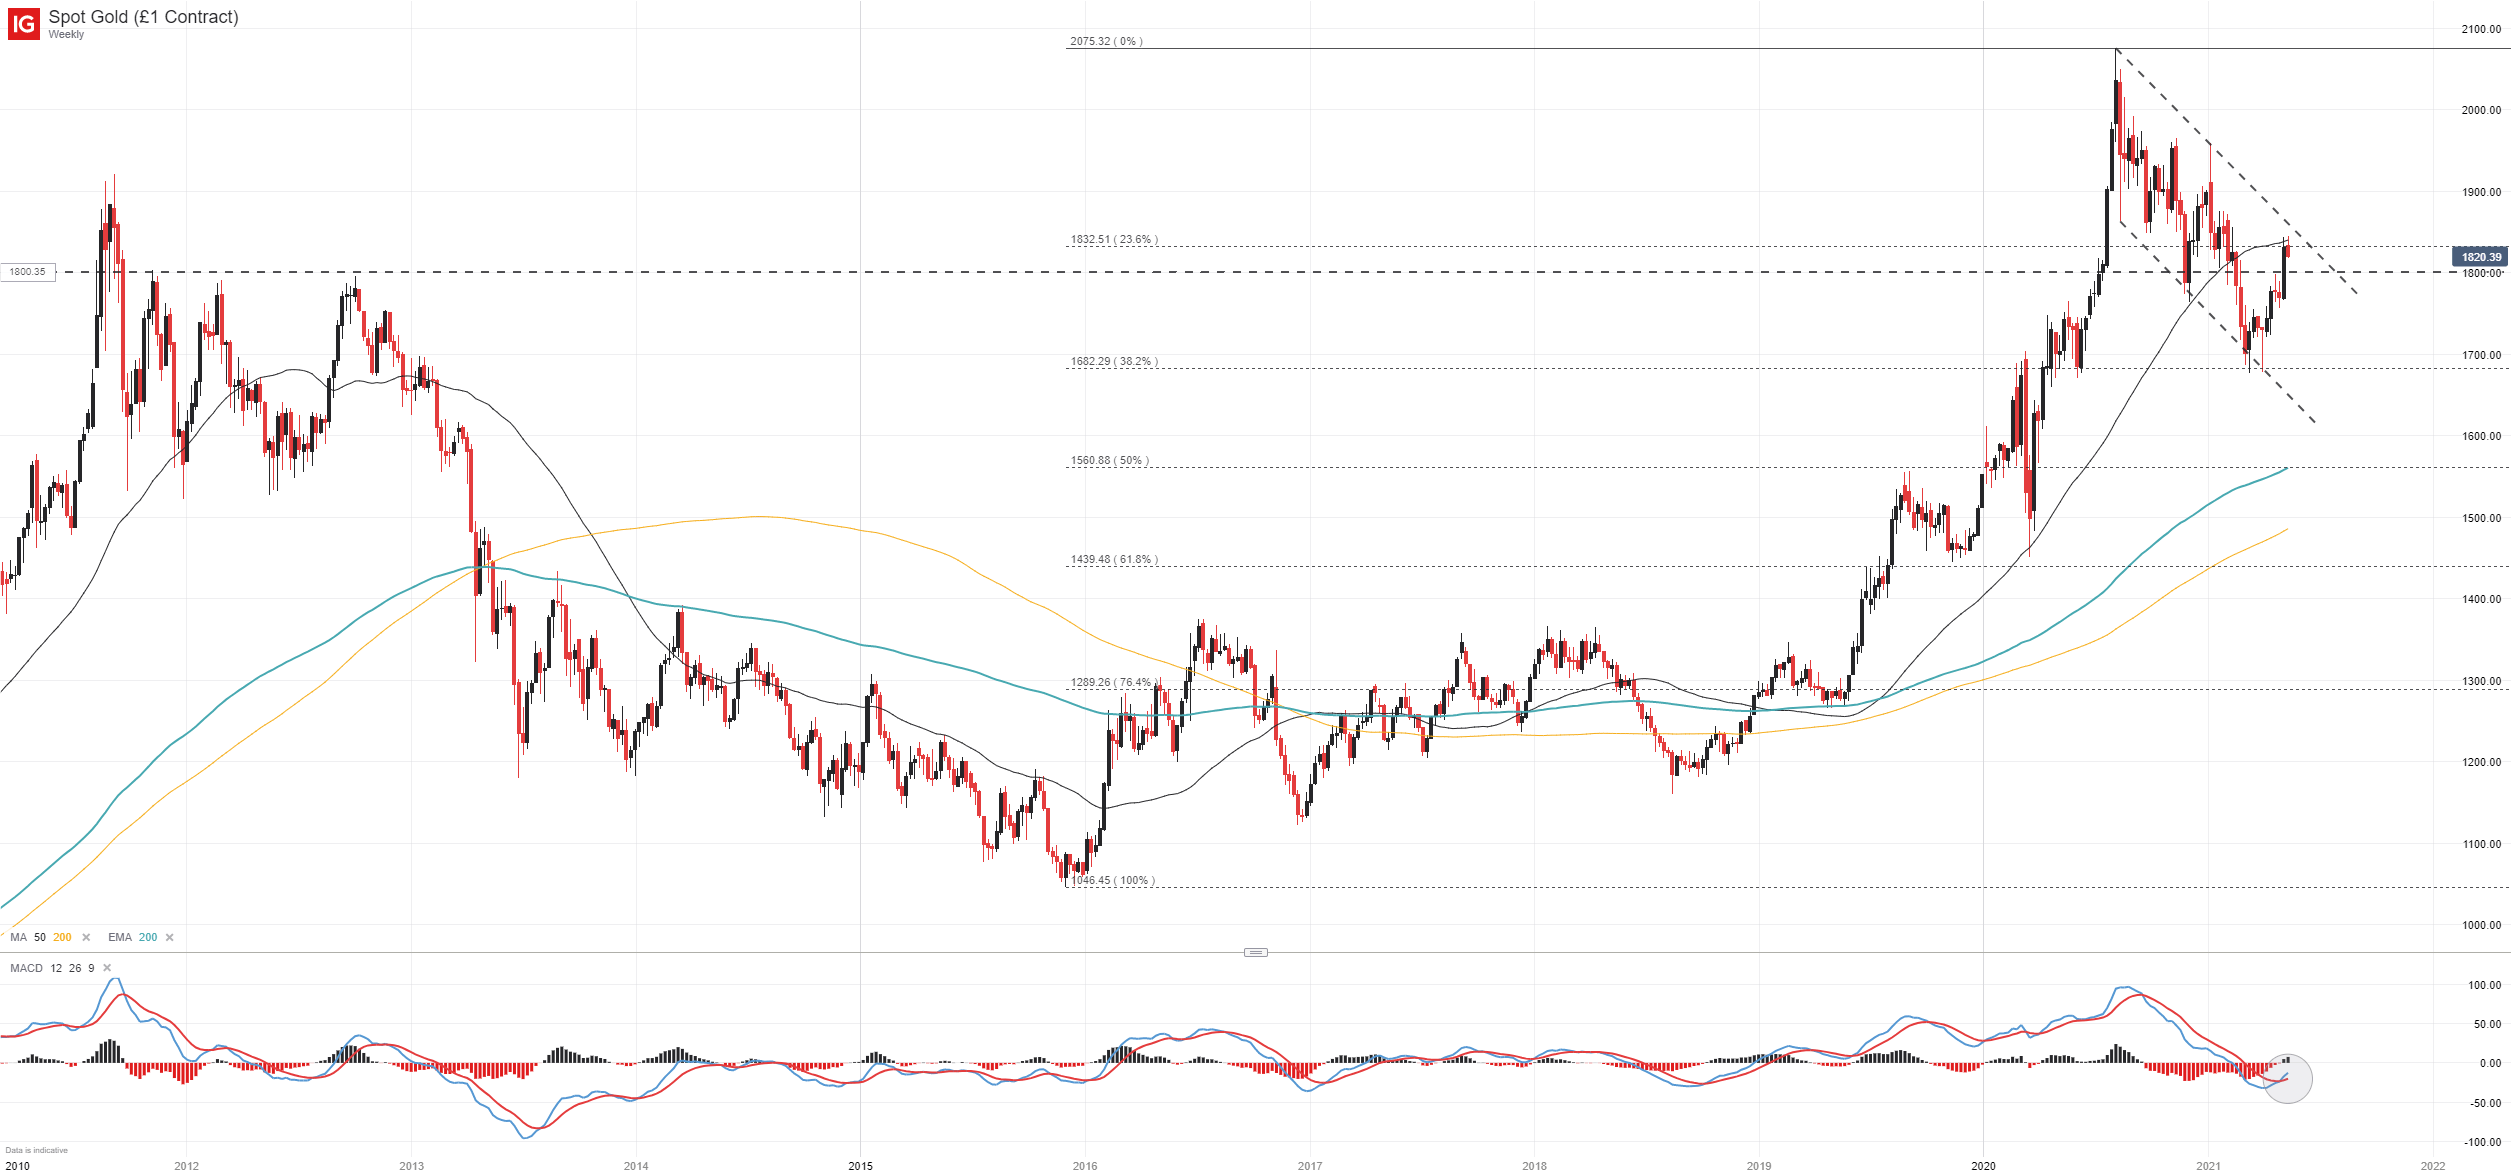
Gold (XAU/USD) Price Chart: Weekly Time Frame (January 2010 - May 2021)
How to Trade Gold: Top Gold Trading Strategies and Tips
While months of gradual losses have seen gold slip into a broader downtrend, the declines followed a remarkable rally throughout 2020 and the resultant weekly price chart hints at a bull flag formation. Typically viewed as a bullish continuation pattern, a potential bull flag at this stage could mean a significant rally lies ahead for gold.
Further still, a bullish MACD crossover has occurred on the weekly chart with price above the 200 exponential moving average. Such a culmination of factors has not appeared on the weekly chart since August 2012. With that in mind, there is no guarantee price will rally as past results are not indicative of future returns.

As it stands, gold will have to break $1850 before it can snap the downtrend. If done with confidence and followed through with conviction, then breakout trading strategies may come into play. In the meantime, follow @PeterHanksFX on Twitter for updates and analysis.

--Written by Peter Hanks, Strategist for DailyFX.com
Contact and follow Peter on Twitter @PeterHanksFX


