


Euro Technical Forecast – Talking Points
- EUR/USD consolidation may lead to a selloff as strength eases
- EUR/AUD may look to retest former Rising Wedge support
- EUR/JPY slightly lower after recording new multi-year high

EUR/USD Technical Breakdown
The Euro has advanced against a broadly weak US Dollar month-to-date, with EUR/USD up just over a full percentage point. Resistance over the past week has seen fading upside pressure, defined by a trendline that loosely forms a Rising Wedge pattern. Currently, the support line of that wedge appears to be in danger of giving way to downward price action.
That said, EUR/USD may see a near-term selloff, with possible support from the rising 20-day Simple Moving Average (SMA). An extended selloff, however, could see prices drop to the psychologically imposing 1.2 handle. Alternatively, a move higher would aim to break above resistance to see new ground. Momentum appears weak with a downward trending Relative Strength Index (RSI) and a weakening MACD.
EUR/USD 8-Hour Chart
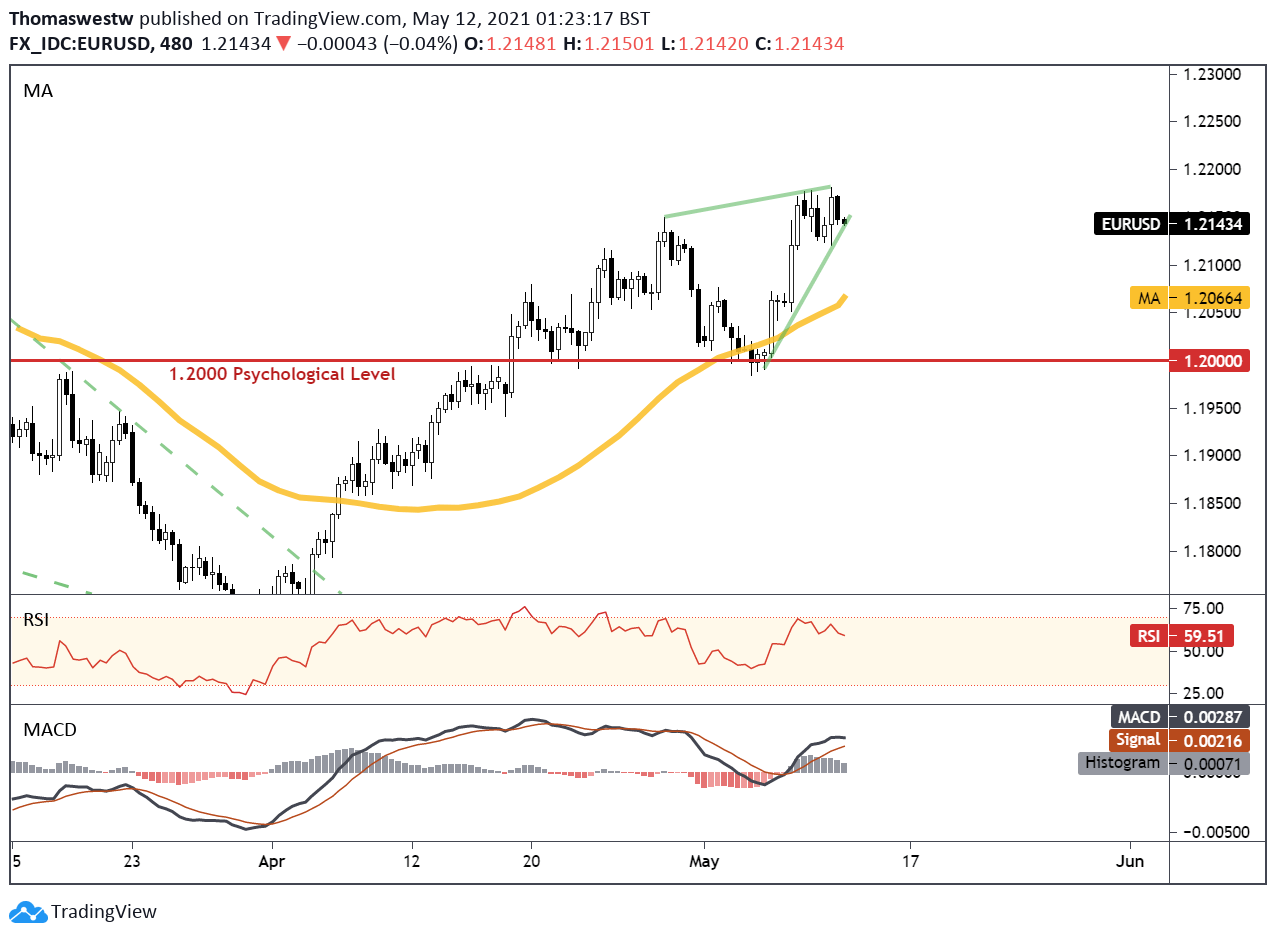
Chart created with TradingView
EUR/AUD Technical Breakdown
The Euro has surrendered over a half percentage point since the start of this month, but some upward movement in EUR/AUD may be nearing. The currency pair broke resistance from a Rising Wedge pattern earlier this month and rested the broken support level overnight before sputtering out short of recapturing the trendline.
The MACD appears to be aiming to cross above its signal line, which is seen as a classic bullish technical sign. Moreover, the RSI is rising with a cross above the neutral 50 level in sight. That said, EUR/AUD will aim to break above the former support line once more on a move higher. On the other hand, a shift lower would see the 61.8% Fibonacci retracement level shift into focus to underpin prices.
EUR/AUD 8-Hour Chart
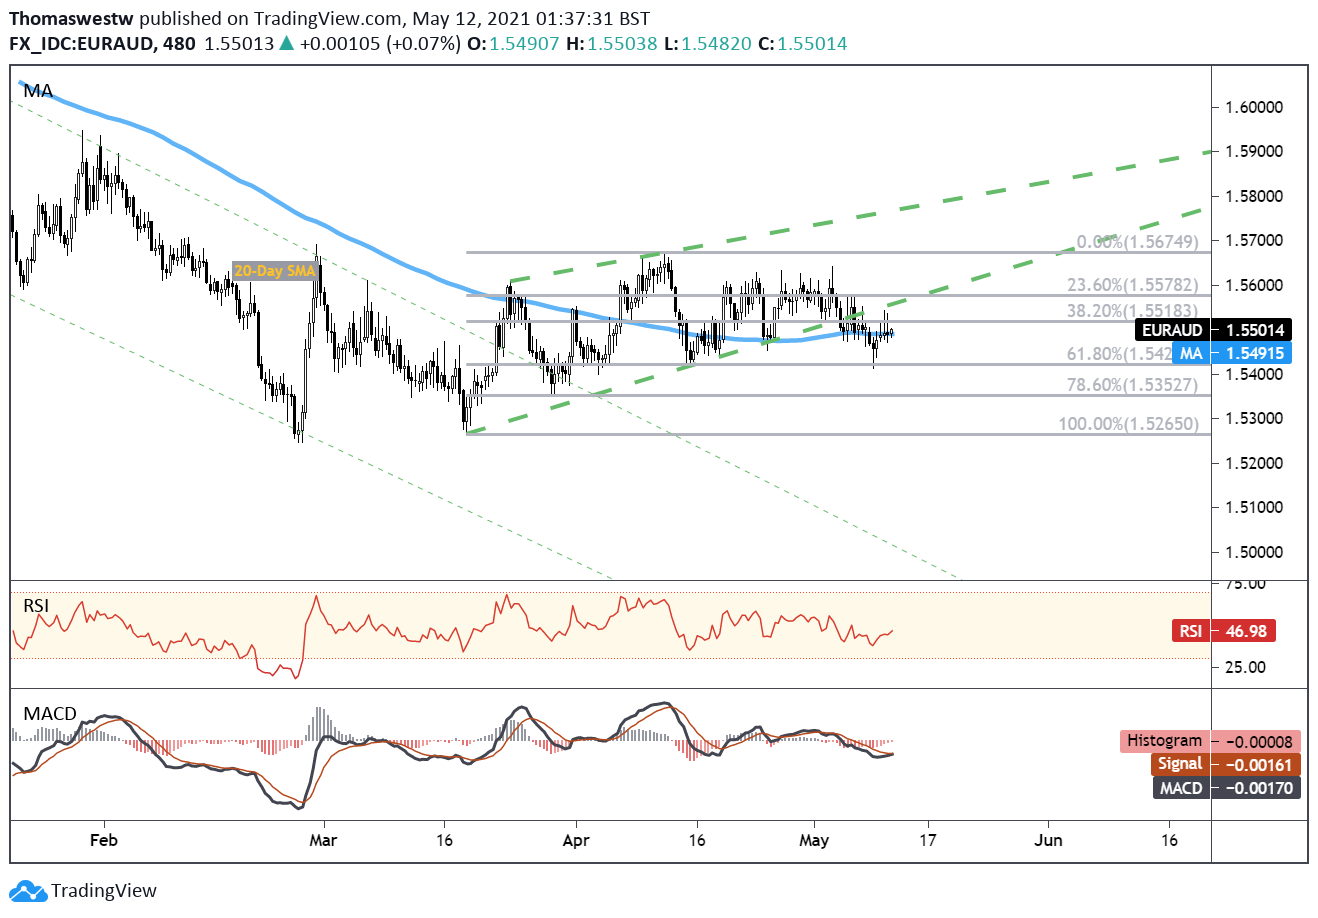
Chart created with TradingView
EUR/JPY Technical Breakdown
EUR/JPY recorded a new multi-year high earlier this week, marking the highest level for the Euro versus the Japanese Yen since September 2018. The recent high was preceded by a phase of consolidation through most of April. Prices may moderate following the burst of strength, but the technical bias appears to favor the upside slightly.
Currently, the 23.6% Fibonacci retracement from the late April to May move at 131.82 is supporting prices. The rising 9-day Exponential Moving Average may step in to provide support if EUR/JPY breaks that Fib level. Alternatively, a rebound higher brings the recent multi-year high directly into view. A move over that high at 132.52 would likely extend gains further.
EUR/JPY 8-Hour Chart
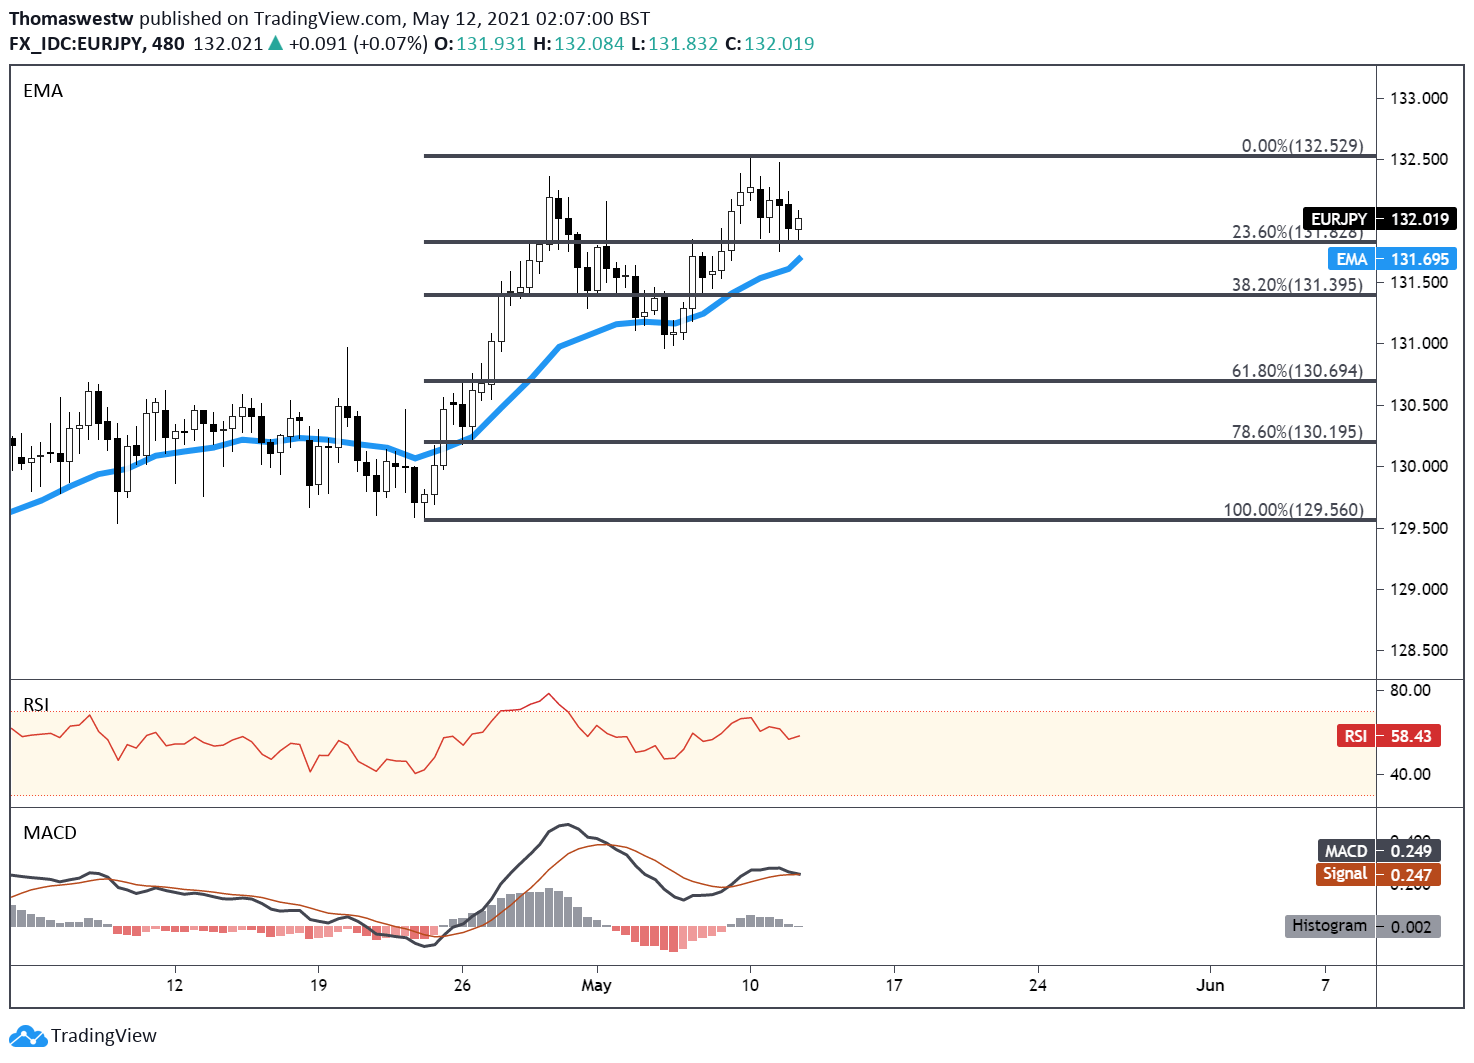
Chart created with TradingView
EUR/USD, EUR/AUD, EUR/JPY TRADING RESOURCES
- Just getting started? See our beginners’ guide for FX traders
- What is your trading personality? Take our quiz to find out
- Join a free webinar and have your trading questions answered
- Subscribe to the DailyFX Newsletter for weekly market updates
--- Written by Thomas Westwater, Analyst for DailyFX.com
To contact Thomas, use the comments section below or @FxWestwater on Twitter


