Stock Market (Nasdaq 100) Price Outlook:
- The Nasdaq 100 has seen its losses outpace that of the Dow Jones and S&P 500 amidst the ongoing reflation trade
- The index’s declines have placed it dangerously close to a key trendline that could open the door to deeper losses if price breaks beneath
- Difference between Dow, Nasdaq, and S&P 500: Major Facts & Opportunities
Stock Market Forecast: Is the Nasdaq 100 At Risk of Deeper Declines?
The Nasdaq 100 has endured considerable volatility in the week thus far as rising Treasury yields and simmering inflationary concerns have worked to pressure technology stocks. While these macroeconomic forces have been in play since the middle of the first quarter, a recent flare up due to incoming economic data is likely to blame for the precipitous losses in the Nasdaq. That said, the Nasdaq 100 may be vulnerable to further losses if the fundamental forces at work do not abate before a key trendline is broken.
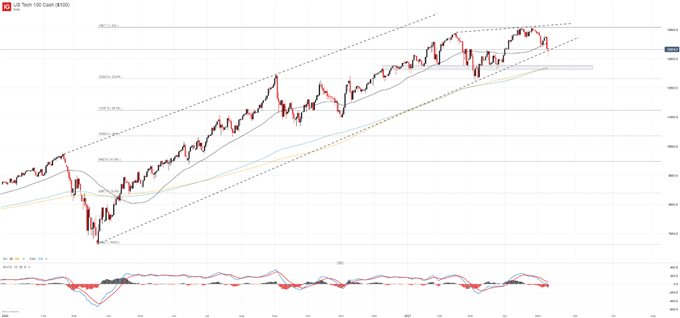
Nasdaq 100 Price Chart: Daily Time Frame (January 2020 – May 2021)

Already, the Nasdaq 100 suffered a brief break beneath the rising trendline projection drawn off the March 2020 and 2021 lows. A break of conviction could see the index threaten a lower-low beneath the 12,320 area which would suggest the Nasdaq is at risk of a broader downtrend.
Stock Market Forecast for the Week Ahead: Reflation Trade Reignited
Thankfully for bulls, the 200-day simple and exponential moving averages reside around a series of swing lows near the 12,700 zone and may look to ward off further declines prior to a test of the 12,320 level.
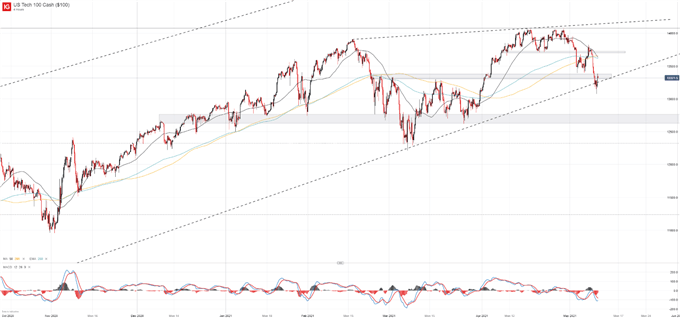
Nasdaq 100 Price Chart: 4 - Hour Time Frame (October 2020 – May 2021)

Either way, a convincing break beneath the rising trendline projection from March 2020 would signal a departure from the broader uptrend that has taken place over the last 14 months and would render the tech-heavy index vulnerable to further declines.
How to Short Sell a Stock When Trading Falling Markets
With that in mind, the Dow Jones and S&P 500 continue to exhibit only modest weakness by comparison and may be the preferred vehicles for long exposure at this time if desired. Further still, traders could consider short exposure on the Nasdaq 100 with bullish positioning on the Dow or S&P 500 as a partial hedge. In the meantime, follow @PeterHanksFX on Twitter for updates and analysis.


--Written by Peter Hanks, Strategist for DailyFX.com
Contact and follow Peter on Twitter @PeterHanksFX


