


GOLD PRICE OUTLOOK:
- Gold prices extended higher after rising sharply following a weak nonfarm payrolls report
- The DXY US Dollar declined to a 10-week low, buoying precious metal prices
- The world’s largest gold ETF saw net inflows for the first time in months as bullion prices rebound

Gold prices registered a two-day gain of 2.5% and soared to above $ 1,830 mark on Monday as fears surrounding tapering Fed stimulus cooled. A much lower-than-expected US nonfarm payrolls print sent the DXY US Dollar index to a ten-week low, buoying precious metal prices.
Friday’s report showed that nonfarm jobs increased 266k in April, a far cry from market expectations of a 978k rise. March’s figures was revised down to 770k from 916k, underscoring a shortage in labor supply. This suggests that the job market may take longer to fully recover from the pandemic, and thus more time is needed for the Fed to consider tapering stimulus measures.
Meanwhile, a weaker jobs report also strengthened the prospect of fiscal spending. President Joe Biden said on Friday that his massive infrastructure and family support bills are “needed now more than ever” as job growth slowed in April. Earlier this year, Mr. Biden proposed a US$ 2.3 trillion infrastructure bill to revamp the nation’s transportation infrastructure and create millions of jobs.
The 10-year US treasury yield stabilized at around 1.59% after registering a “V-shaped” rebound on Friday. Gold prices are sensitive to yield changes. Therefore, reflation hopes may drive yields higher if Biden’s fiscal stimulus plan is approved, potentially derailing gold’s upward trajectory.
Looking ahead, traders will eye Wednesday’s US inflation data, which is forecasted to hit 3.6% YoY. Rising price levels may boost the appeal of gold, which is widely perceived as an inflation hedge. A slew of speeches by Fed officials this week will also be closely watched for clues about future monetary policy guidance.
Gold Prices vs. DXY US Dollar Index
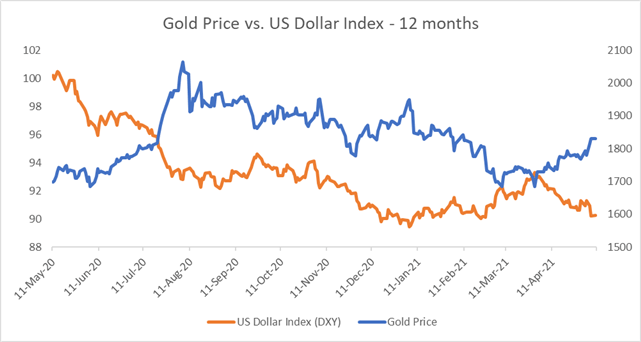
Source: Bloomberg, DailyFX
The world’s largest gold ETF - SPDR Gold Trust (GLD) – saw a small net inflow last week. This suggests that more buyers are returning to the bullion market after months of selling. The number of GLD shares outstanding increasing 2.9 million last week, compared to a net outflow of 1.6 million the prior week. Gold prices and the number of outstanding GLD shares have exhibited a strong positive correlation in the past (chart below). Therefore, a reversal of net redemption may be viewed as a bullish signal.
Gold Price vs. GLD ETF Shares Outstanding – 12 Months
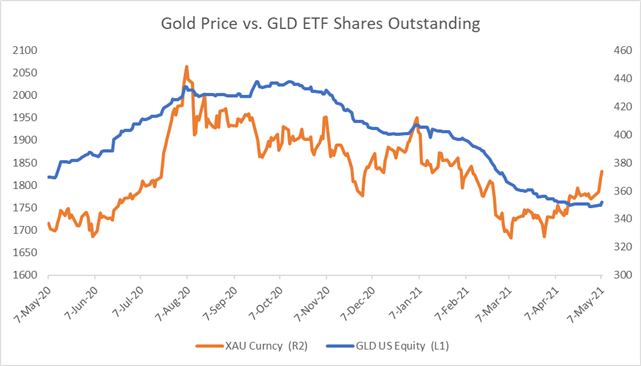
Source: Bloomberg, DailyFX
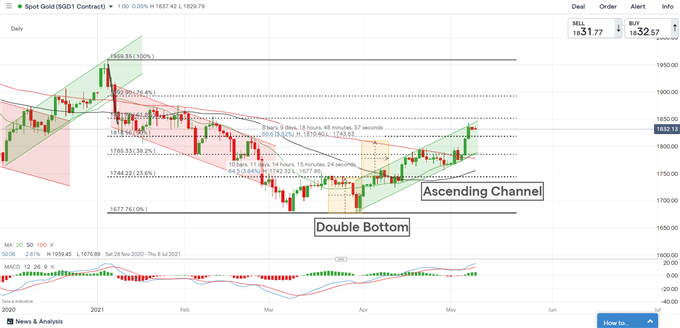
Technically, gold prices extended higher within an “Ascending Channel” after completing a “Double Bottom” chart pattern. This suggests that gold prices may have found a mid-term bottom at around $ 1,677 and since resumed its upward trajectory. An immediate support level can be found at $ 1,810 (the 50% Fibonacci retracement), whereas an immediate resistance level can be found at $ 1,851 (the 61.8% Fibonacci retracement).
The MACD indicator is trending higher above the neutral midpoint, underscoring upward momentum.
Gold Price – Daily Chart
| Change in | Longs | Shorts | OI |
| Daily | -6% | 3% | -2% |
| Weekly | 3% | -11% | -4% |
--- Written by Margaret Yang, Strategist for DailyFX.com
To contact Margaret, use the Comments section below or @margaretyjy on Twitter


