


Gold (XAU/USD) Analysis, Price and Chart
- Gold remains in a range for now.
- Fed meeting, US data, and tech company earnings may drive volatility.

Gold traders need to be aware that there is a slew of potential drivers of a range breakout on the horizon, as the latest FOMC decision and outlook, US Q1 GDP numbers, and a host of big technology company results collide this week. The Federal Reserve is expected to keep all policy measures unchanged but it is chair Powell’s post-release remarks, especially on inflation and tapering, that need to be followed closely. On the data calendar, today’s consumer confidence number will be followed by the first look at US Q1 GDP on Thursday and PCE – the Feds preferred measure of inflation – on Friday. US data has been strong of late and the market forecast of Q1 GDP (6.5%) may be low, sparking fears of an inflationary surge down the line. The latest Atlanta Fed GDPNow estimate for Q1 – a running estimate of GDP growth – is 8.2%, substantially higher than current market estimates.
US Q1 earnings season is in full flow with tech giants including Alphabet, Apple, Facebook, Microsoft, and Twitter all reporting this week. Any misses by these tech companies will likely dampen the current bullish equity sentiment, giving gold a haven-bid. In turn, any beats by these companies will boost positive sentiment and weigh on the precious metal.
For all market-moving events and data releases, see the DailyFXCalendar
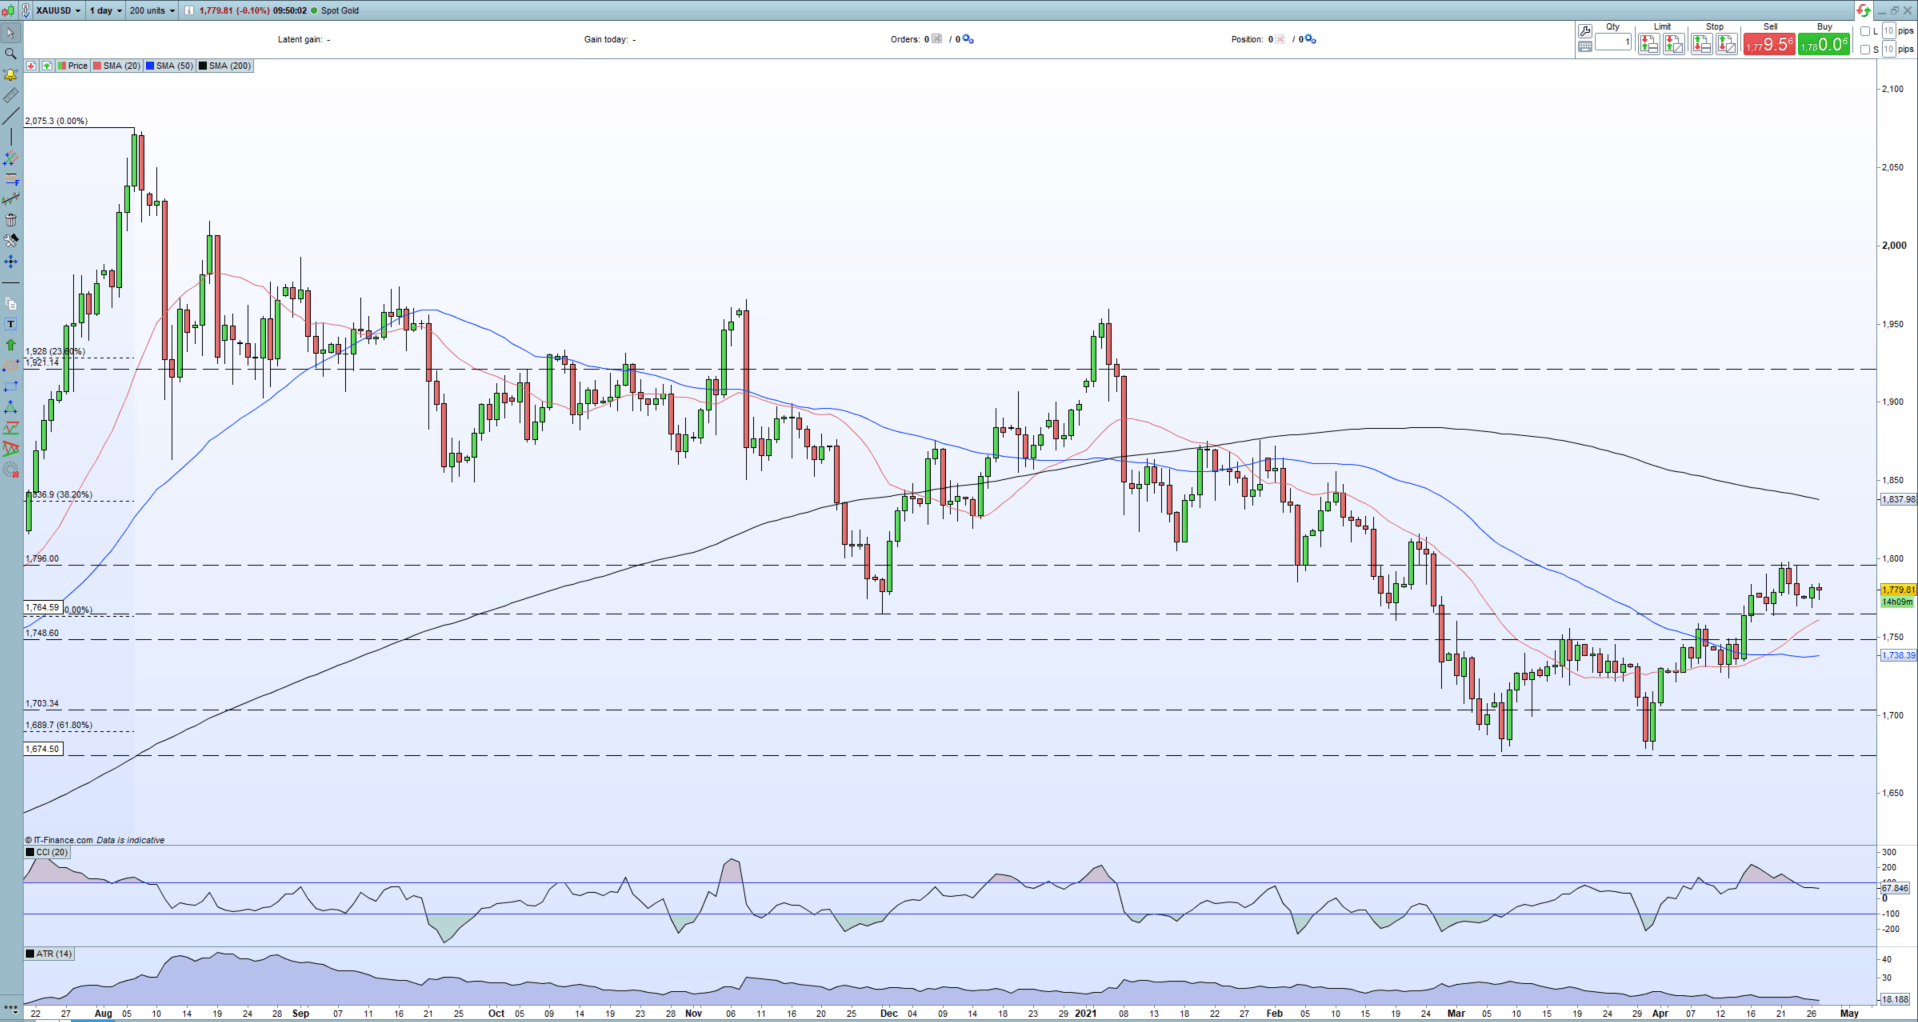
The daily chart shows gold trapped between old resistance between $1,760-$1764/oz. and a cluster of recent highs topping out at $1,800/oz. The precious metal has moved out of overbought territory, while the 20-day sma and 50-day sma crossover gives the precious metal a positive look. It is difficult to say with conviction which way a break may occur but the likelihood is that a break will happen soon with all the volatile events this week.
Moving Average (MA) Explained for Traders
Gold Daily Price Chart (July 2020 – April 27, 2021)
| Change in | Longs | Shorts | OI |
| Daily | 0% | -1% | -1% |
| Weekly | 7% | -10% | -2% |
Client sentiment data show 81.70% of traders are net-long with the ratio of traders long to short at 4.46 to 1. We typically take a contrarian view to crowd sentiment, and the fact traders are net-long suggests Gold prices may continue to fall.
Yet traders are less net-long than yesterday and compared with last week. Recent changes in sentiment warn that the current Gold price trend may soon reverse higher despite the fact traders remain net-long.
What is Market Sentiment and How Does it Work?
What is your view on Gold – are you bullish or bearish?? You can let us know via the form at the end of this piece or you can contact the author via Twitter @nickcawley1.


