


GOLD PRICE OUTLOOK:
- Gold prices paused a rally after India reported a record number of daily coronavirus infections
- Reduced demand for gold from India may be offset by rising Chinese imports
- US jobless claims came lower-than-expected, denting the appeal of gold as a safe haven

Gold prices paused a rally and retreated form an eight-week high after India reported the world’s highest daily Covid-19 infections of 314,835 on Thursday. The rapid spread of the virus in the country dented the demand outlook from the world’s fourth largest bullion importer. India imported US$ 32.2 billion worth of gold, or 10.5% of the world’s total in 2019.
Health officials across northern and western India said they were in crisis, with most hospitals full and running out of oxygen. Many countries have tightened border restrictions for travelers from India, including the US, the UK, Singapore and New Zealand. Stricter social distancing measures and lockdowns are expected to dent domestic demand for gold as the pandemic situation worsens in the country.
On the other hand, the prospect of rising Chinese demand could help to offset the decline from India. The People’s Bank of China (PBoC) was reported to have allowed domestic and foreign commercial lenders to import a large amount of gold to meet domestic demand ahead of the “Golden Week” holiday, which falls in early May. The central bank has granted a quota of 150 tons for the metal, the highest since the pandemic. This would signal a return of Chinese buyers to the global bullion market, potentially driving prices higher.
Daily New Confirmed COVID-19 Cases per Million People - India
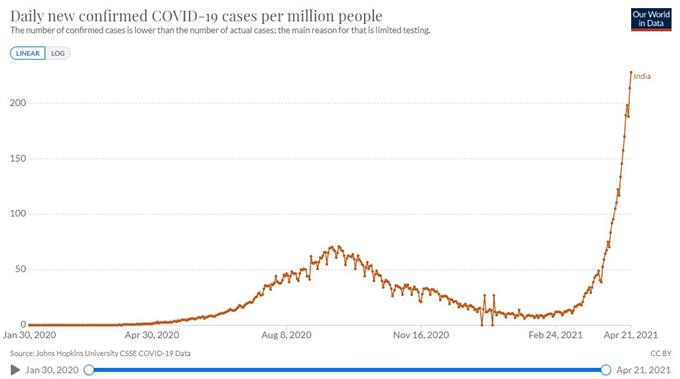
Source: Our World in Data
Applications for US unemployment benefits fell to a fresh pandemic low, reflection continuous improvement in the American job market as Covid-related restrictions eased. The weekly jobless claims came in at 547k, beating a baseline forecast of 617k (chart below). A better-than-expected fundamental outlook revitalized reflation hopes and may drive down the demand for non-yielding gold as an investment asset.
Meanwhile, President Joe Biden’s plan to hike capital gains tax for wealthier Americans led to a broad pullback in risk assets overnight. Souring risk appetite may buoy the appeal of gold as a perceived safe-haven, cushioning the downside.
US Weekly Jobless Claims Dropped to the Lowest Level since Pandemic
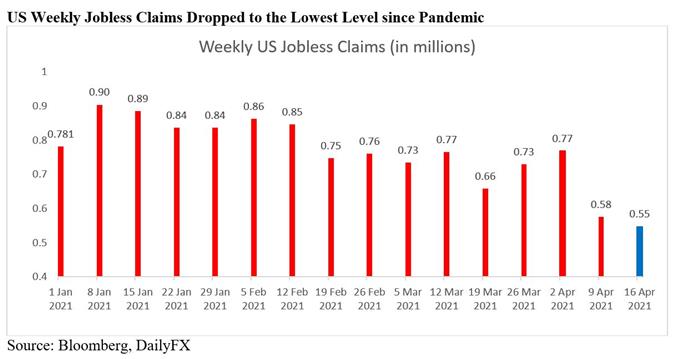
Source: Bloomberg, DailyFX
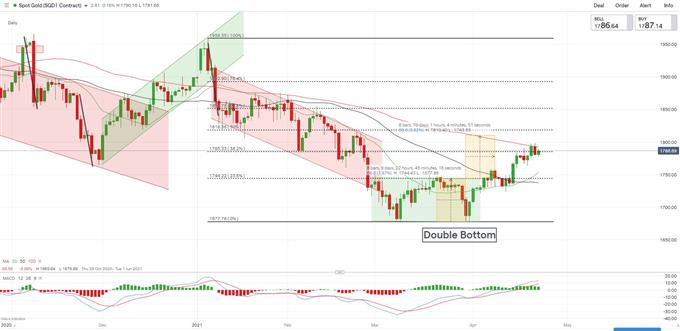
Technically, gold has likely formed a “Double Bottom” chart pattern after hitting US$ 1,677 twice. The “Double Bottom” pattern usually appears at the end of a downtrend and may be viewed as a strong bullish signal. Prices are facing some selling pressure near an immediate resistance level at US$ 1,785 - the 38.2% Fibonacci retracement. A successful attempt to breach this level may open the door for further upside potential with an eye on 1,810 - a target level that the “Double Bottom” pattern implies.
The MACD indicator is extending higher above the neutral midpoint, suggesting that momentum remains bullish-biased.
Gold Price – Daily Chart
| Change in | Longs | Shorts | OI |
| Daily | -1% | -3% | -2% |
| Weekly | 6% | -11% | -2% |
--- Written by Margaret Yang, Strategist for DailyFX.com
To contact Margaret, use the Comments section below or @margaretyjy on Twitter


