


GOLD PRICE OUTLOOK:
- Gold prices extended higher during APAC trading hours amid a broad pullback in equities
- Viral resurgence led to renewed concerns about economic recovery, boosting demand for safety
- The world’s largest gold ETF saw a slower pace of redemption, hinting at price gains

Gold prices rallied to an eight-week high as viral resurgence in some parts of the world dampened the growth outlook, boosting the demand for safety. Risk appetite soured during early in the APAC trading session after Netflix reported disappointing new subscriber growth in the first quarter of 2021. This signaled that the rapid growth phase for tech companies may have reached an inflection point.
Despite strong economic data released in the US and China recently, growth prospects appeared to be uneven in other parts of the world. Europe is struggling with a third viral wave and India is reporting an accelerated pace of increase in coronavirus infections (chart below). Japan saw tepid domestic demand as lockdowns in the Tokyo area and a slow pace of vaccination hindered an economic rebound.
Against this backdrop, the reflation trade may take a pause as investors reassess the scope for recovery and reshuffle their portfolios towards a more balanced setting.
Cumulative Confirmed Covid-19 Cases
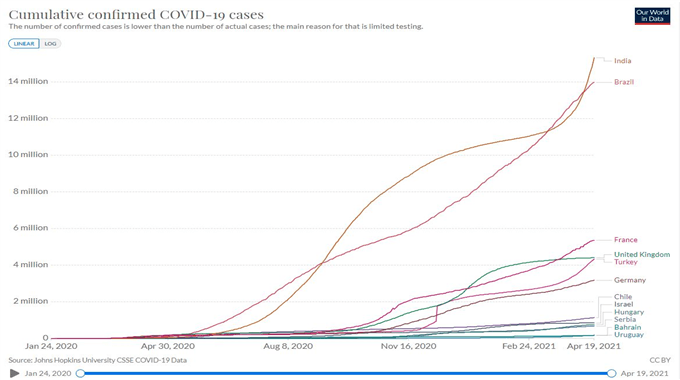
Source: Our World in Data
Capital fled into defensive sectors and safe-havens such as Treasuries, sending the 10-year rate to a five-week low of 1.56%. The real yield, as represented by the 10-year inflation-indexed security, declined 2 bps to -0.77% overnight. Falling real yields boosted the appealing of the precious metals as the opportunity cost of holding them decreased.
Looking ahead, inflation data from the UK and Canada will be closely monitored by gold traders alongside the Bank of Canada (BoC) interest rate decision. Recently, data released from US and New Zealand showed that price levels are rising at a faster-than-expected pace, which served as positive catalysts for gold as it was widely perceived as an inflation hedge. Find out more from the DailyFX calendar.
Gold Prices vs. 10-Year Treasury Inflation-Indexed Security
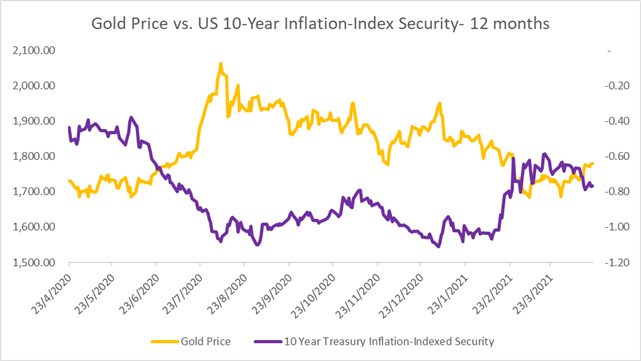
Source: Bloomberg, DailyFX
The world’s largest gold ETF - SPDR Gold Trust (GLD) – saw slower pace of capital outflow over the past few weeks (chart below), suggesting that more buyers are returning to the bullion market compared to sellers. The number of GLD shares outstanding declined 2.4 million over the last two weeks, compared to a 7.8 million decrease seen in the prior two weeks. Gold prices and the number of outstanding GLD shares have exhibited a strong positive correlation of 0.85 over the past 12 months. Therefore, a decelerated pace of net redemption can be viewed as a bullish signal.
Gold Price vs. GLD ETF Shares Outstanding – 12 Months
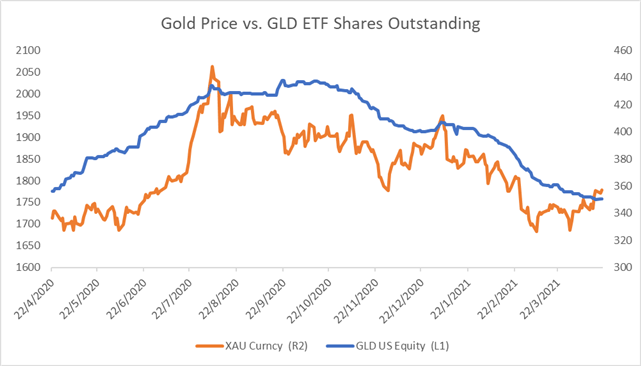
Source: Bloomberg, DailyFX
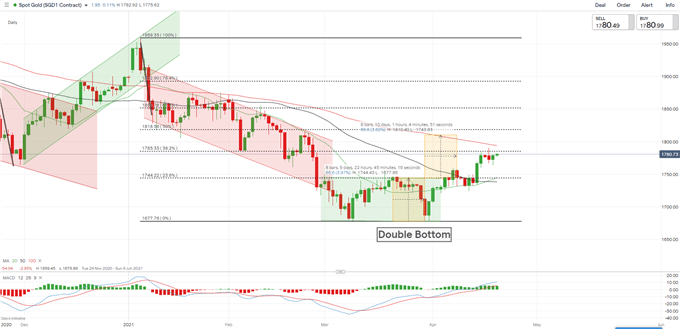
Technically, gold has likely formed a “Double Bottom” chart pattern after hitting US$ 1,677 twice. The “Double Bottom” pattern usually appears at the end of a downtrend and may be viewed as a strong bullish signal. Prices are facing an immediate resistance level at US$ 1,785 - the 38.2% Fibonacci retracement. A successful attempt to breach this level may open the door for further upside potential with an eye on US$ 1,818 – the 50% Fibonacci retracement. A swing lower however, may bring the immediate support level of US$ 1,744 (previous resistance) into focus.
Gold Price – Daily Chart
| Change in | Longs | Shorts | OI |
| Daily | 1% | -6% | -2% |
| Weekly | 10% | -12% | -1% |
--- Written by Margaret Yang, Strategist for DailyFX.com
To contact Margaret, use the Comments section below or @margaretyjy on Twitter


