


Gold (XAU/USD) Analysis, Price and Chart
- Gold eyes $1,800/oz.
- Retail sentiment is mixed despite traders being heavily long of gold.

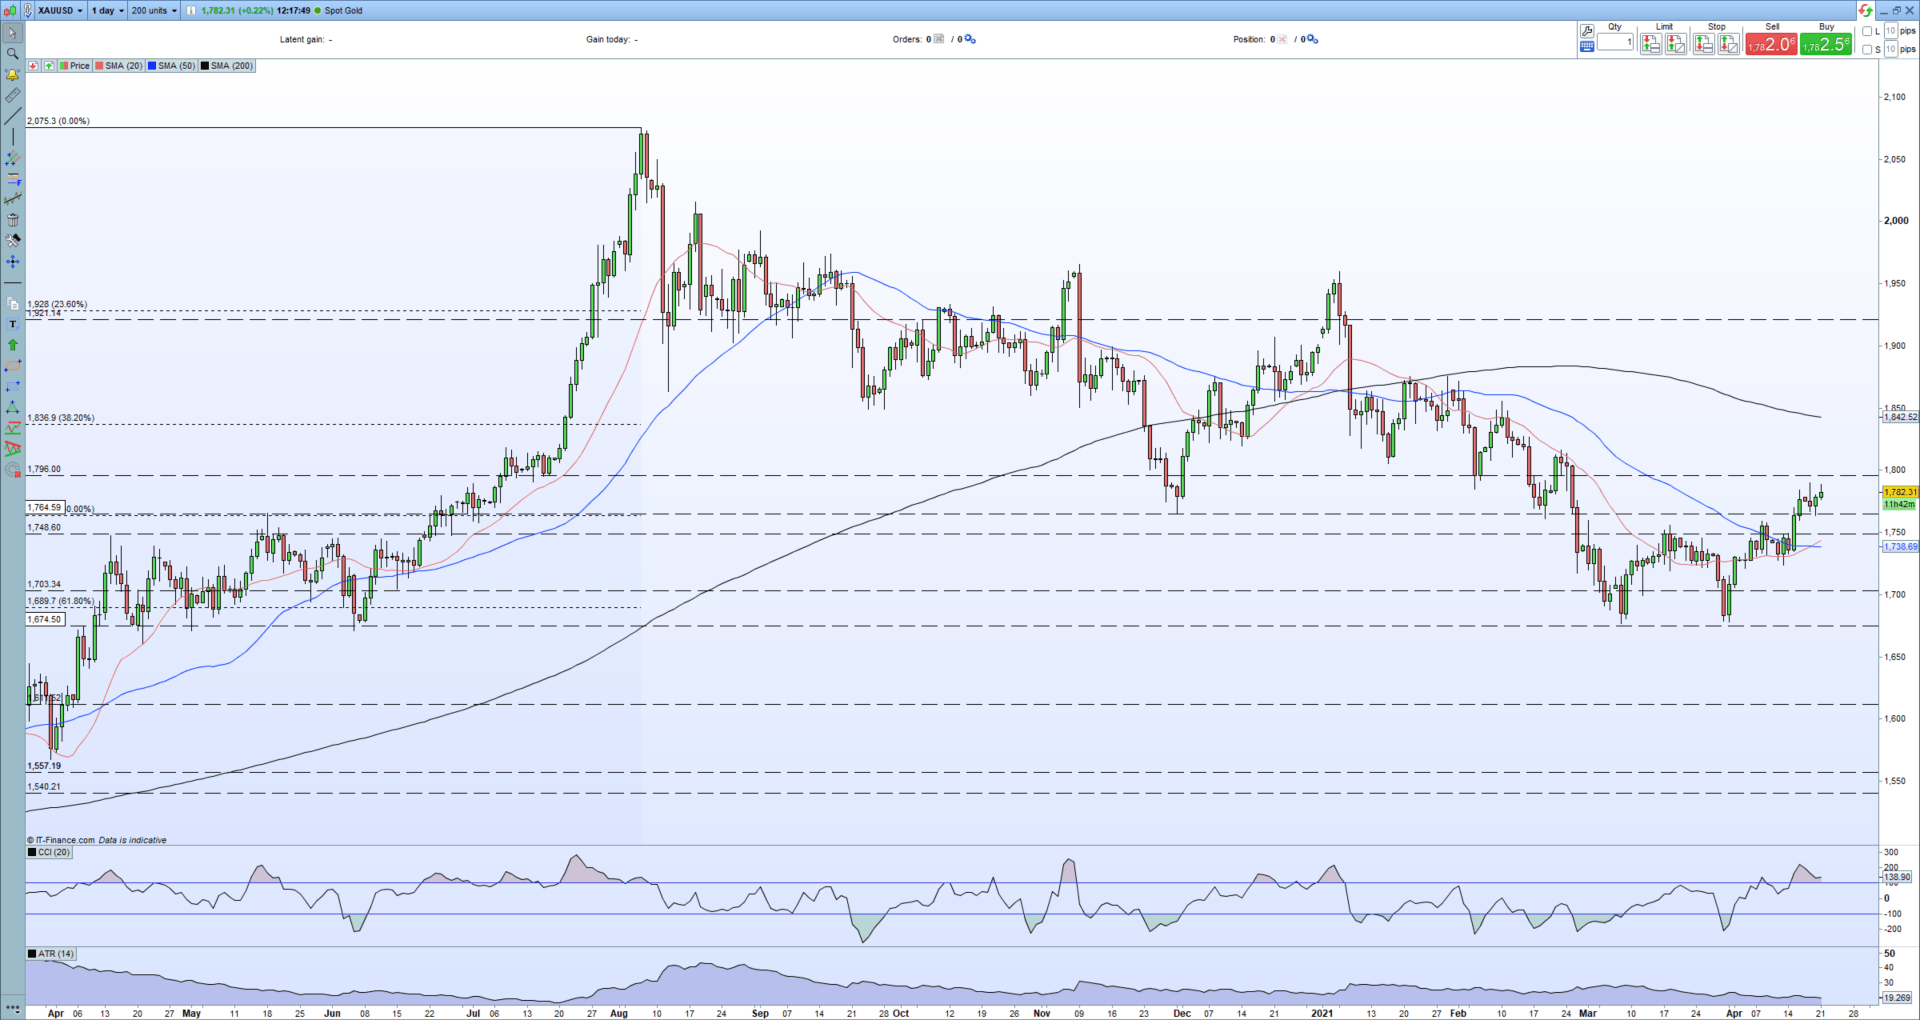
Gold is continuing to press higher and is now around $100/oz. higher than the recent double-low print made in early/late March. This double-low was just below the 61.8% Fibonacci retracement level at $1,689/oz. and the 50% Fibonacci retracement level around the $1,764/oz is now acting as a new level of support. If this continues to hold, the precious metal is likely to attempt to break back above $1,800/oz. before it eyes the 38.2% Fib level at $1,837/oz.
For all market-moving events and data releases, see the DailyFXCalendar
The fluctuations in the US dollar have been one of the main drivers in gold’s price action lately and this is expected to continue. The 10-year US Treasury yield is currently in the middle of a 1.50%-1.75% range and while this remains the case then gold is expected to trade in a sideways pattern. Strong US economic data continues to point to higher US inflation – a gold negative – although the central bank continues to see any rise in price pressure as transitory. The Fed remains focussed on the US jobs market as their main area of concern and while the unemployment rate fell to 6.0% in March, it is still 2.5 percentage points higher than its pre-pandemic level in February 2020.
One signal on the daily gold chart suggests shirt-term bullish potential with the 20-day simple moving average moving above the medium-term 50-day sma. This cross-over confirms the positive sentiment in the market and may help to extend gold’s recent rally. The CCI indicator shows gold in overbought territory and this reading may have to move into neutral territory before the next leg higher.
Moving Average (MA) Explained for Traders
Gold Daily Price Chart (March 2020 – April 21, 2021)
| Change in | Longs | Shorts | OI |
| Daily | -3% | 11% | 4% |
| Weekly | -1% | -5% | -3% |
Client sentiment data show 82.34% of traders are net-long with the ratio of traders long to short at 4.66 to 1. The number of traders net-long is 0.69% higher than yesterday and 6.36% higher from last week, while the number of traders net-short is 3.97% higher than yesterday and 9.04% lower from last week.
We typically take a contrarian view to crowd sentiment, and the fact traders are net-long suggests Gold prices may continue to fall.Positioning is less net-long than yesterday but more net-long from last week. The combination of current sentiment and recent changes gives us a further mixed Gold trading bias.
What is Market Sentiment and How Does it Work?
What is your view on Gold – are you bullish or bearish?? You can let us know via the form at the end of this piece or you can contact the author via Twitter @nickcawley1.


