


DOGE, Bitcoin (BTC/USD) Outlook:
- Dogecoin made another run at highs around the .40 level in celebration of ‘DODGE Day’
- Bitcoin bulls strive to push prices higher but bears are holding ground, at least for now
- Is the crypto theme about to get another wave of volatility?
Despite a recent pullback in the prices of major cryptocurrencies, Dogecoin has remained supported as bulls have made an admirable push for fresh highs. As the meme-based alt-coin (originally created as a joke in 2013) secured fifth place in the crypto market-cap hierarchy, crowd psychology remains the primary catalyst of the unprecedented rally.
To learn more about crowd psychology, check out DailyFX Education
For those who don’t recall, it was Tesla CEO Elon Musk who played a major role in fueling the recent Bitcoin rally as key market participants followed Musk in adopting BTC/USD as an alternative method of payment. Likewise, it was another one of Musk’s optimistic crypto tweets that has once again sparked a rapid surge in the demand for Dogecoin, allowing it to maintain its current bullish narrative. However, as discussed in Friday’s article, there is very little analytical evidence that can be used to justify this exorbitant move.

Dogecoin (DOGE/USD) Daily Chart
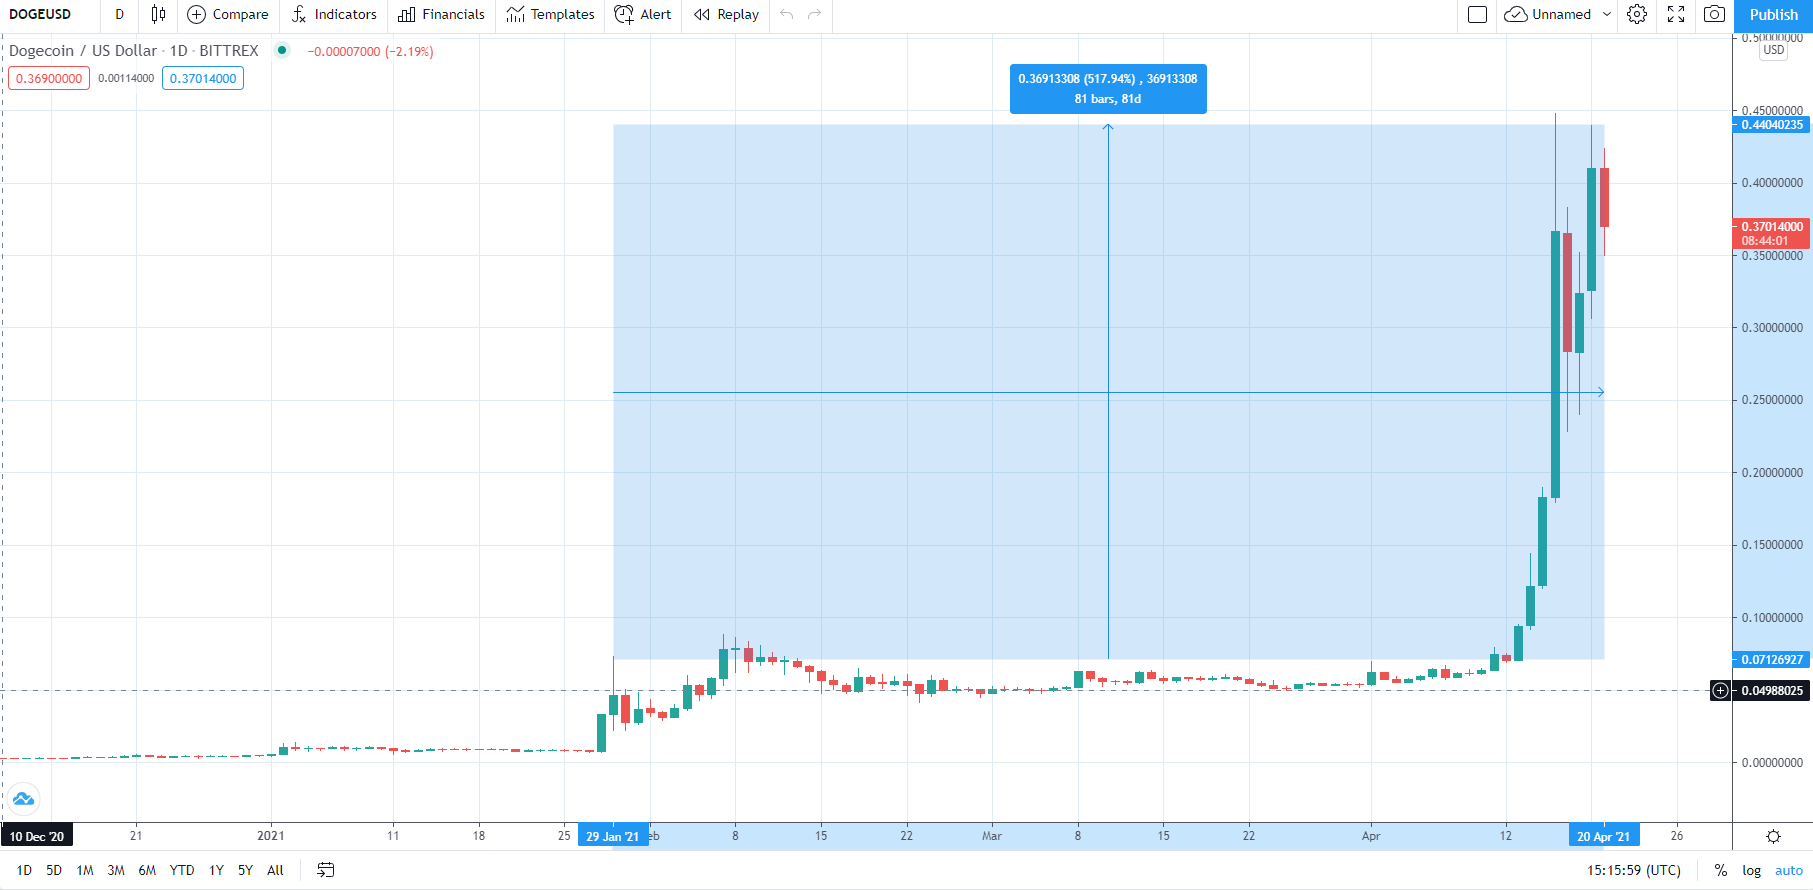
Dogecoin price chart created using TradingView
Bitcoin Bears Temporarily Take Back Control
Although the recent public offering of Coinbase allowed Bitcoin bulls to achieve yet another all-time high, Bitcoin currently continues to trade below the key psychological level of $60k, a former hindrance for bullish momentum.
However, after five consecutive days of losses, BTC/USD price action has temporarily stalled between the key Fibonacci retracement levels of two prominent moves.
After a minor flash crash, Bitcoin remains under pressure as bears continue to drive prices lower in an effort to break support, holding firm at the key psychological level of $55,000. But bulls aren’t giving up without a fight, which makes one wonder if the current pullback is another correction, as seen in prior months or is the crypto ‘Bubble’ finally ready to burst?
Learn more about major financial bubbles, crises and flash crashes
For the first time this year, Bitcoin prices have slipped below both the 20 & 50-period Moving Average (MA), while the Moving Average Convergence/Divergence (MACD) has crossed above the zero line with recent divergence suggesting that the bullish momentum has lost steam.

Bitcoin (BTC/USD) Daily Chart
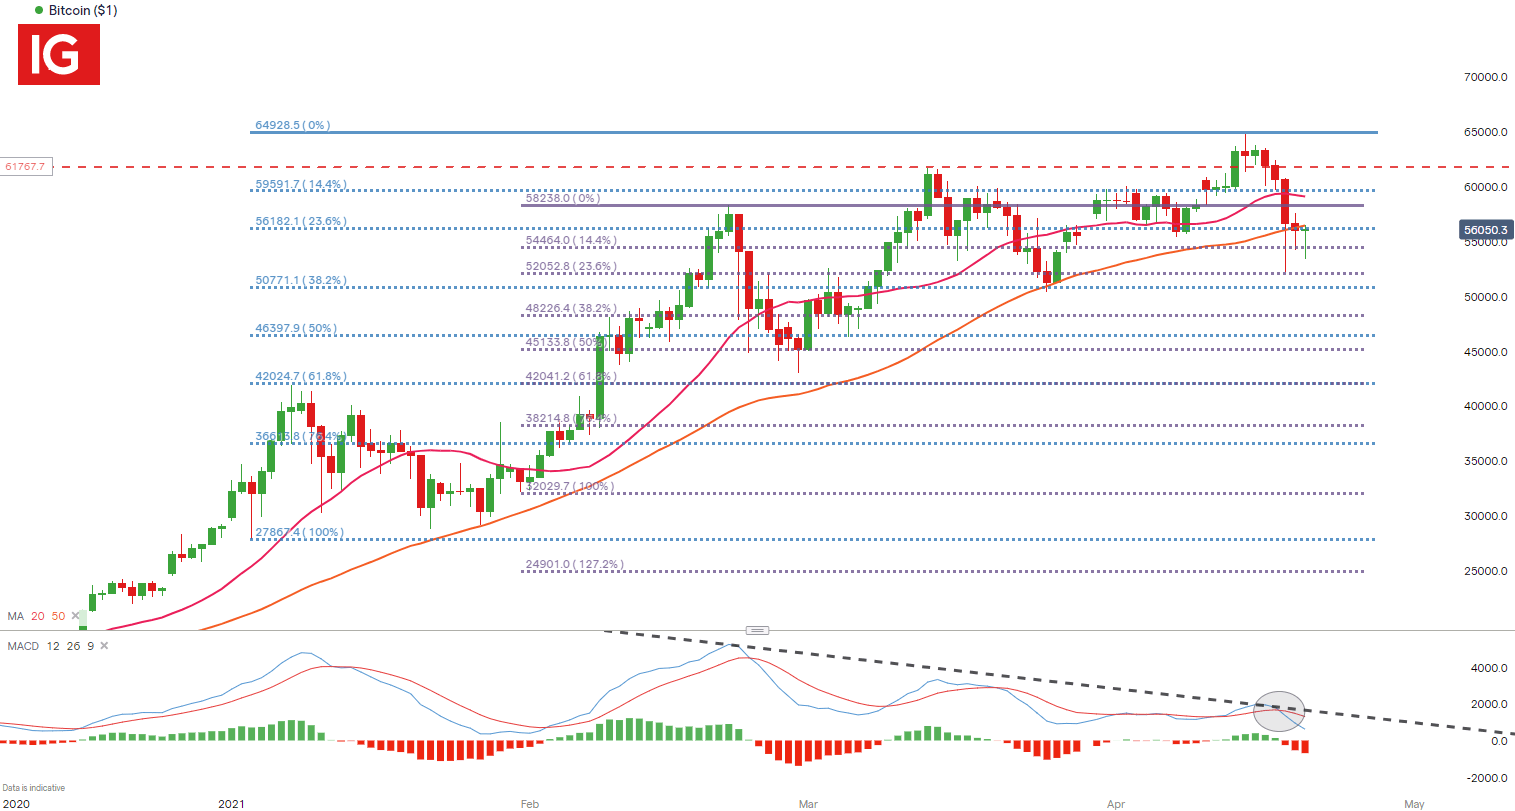
Chart prepared by Tammy Da Costa, IG
With price action currently encapsulated by the 23.6% Fibonacci retracement levels of both the 2021 and the February move, these levels continue to provide support and resistance for the short-term move.
In order for bulls to achieve bullish continuation, they will first need to break above current resistance of $56,182 which could see them retesting the $60k mark.
However, a break of current support, currently residing at $52,052, could see bears pushing below the next key level of $50,000.

--- Written by Tammy Da Costa, Market Writer for DailyFX.com
Contact and follow Tammy on Twitter: @Tams707


