


ZAR ANALYSIS
The Rand has remained robust against its major currency counterparts in 2021 as optimism around a global economic recovery favored Emerging Market (EM) currencies. Local economic woes have yet to be exposed by means of the Rand with external factors safe guarding underlying fundamental weaknesses.
The long-term technical and fundamental picture suggests a short Rand bias which may bring an end to the ZAR’s recent bull run.

TECHNICAL ANALYSIS
USD/ZAR WEEKLY CHART
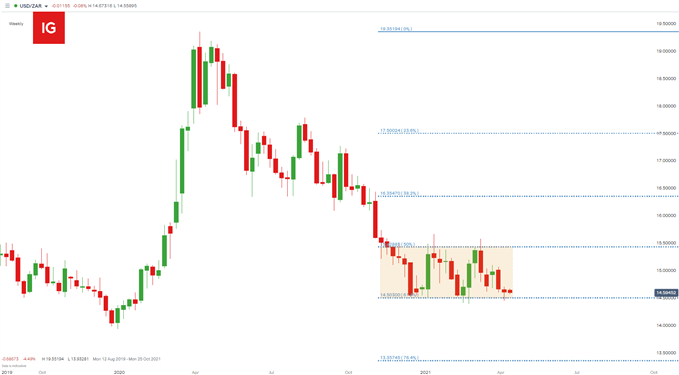
Chart prepared by Warren Venketas, IG
USD/ZAR has been wading through the now well established rectangle pattern (yellow). Price action shows a push off rectangle support (61.8% Fibonacci level) and may be turning upward toward resistance (50% Fibonacci level) – Fibonacci retracement taken from 2018 low to 2020 high.
Discover the basic building blocks of Fibonacci and how it can be applied in Financial markets!
USD/ZAR DAILY CHART
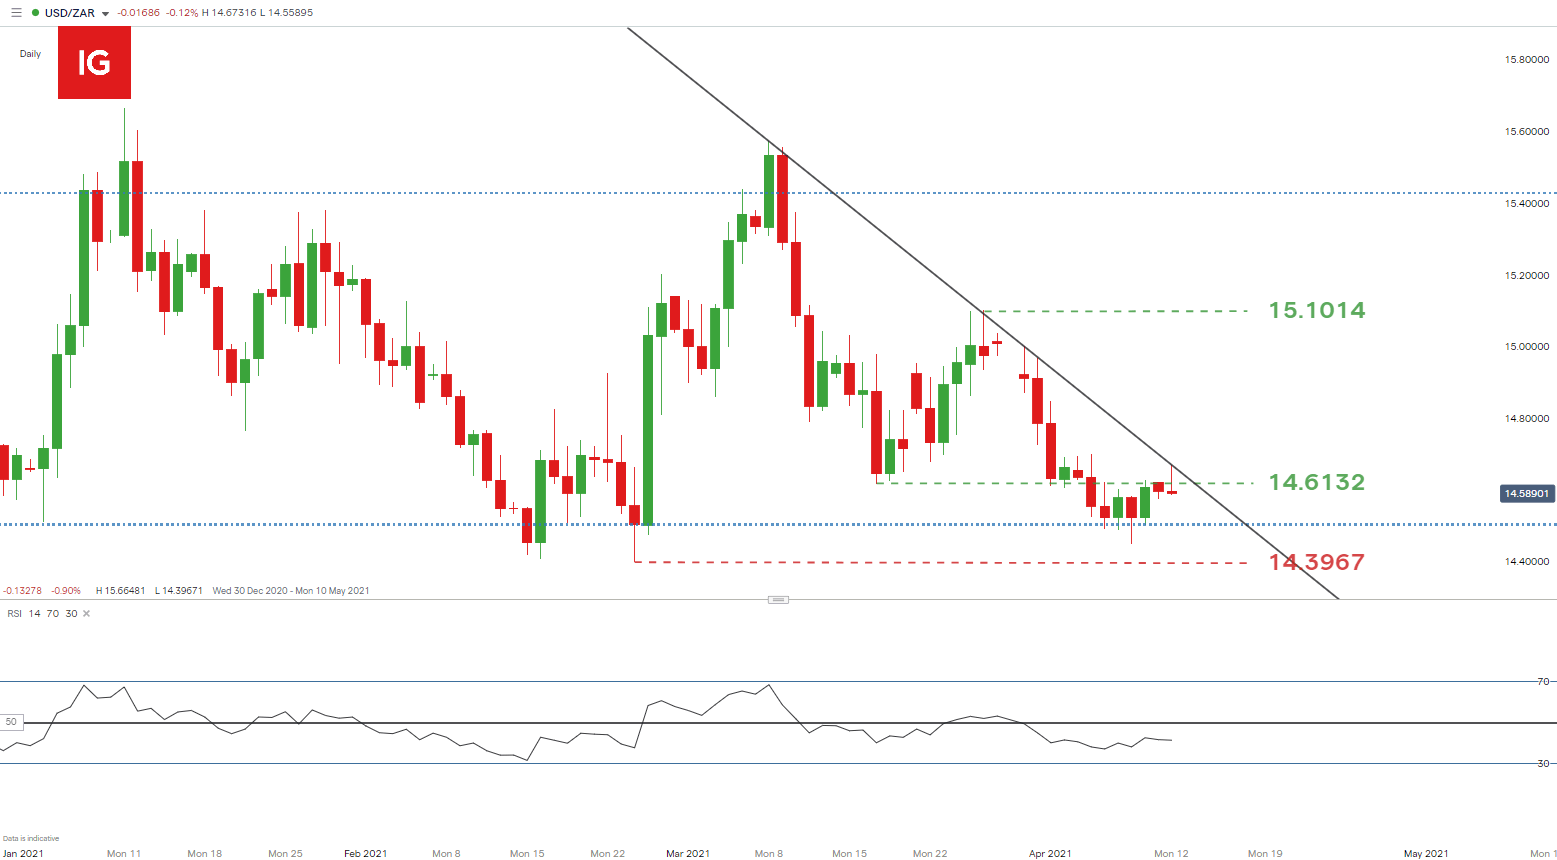
Chart prepared by Warren Venketas, IG
The daily USD/ZAR chart above shows Rand bulls failing to hold prices below the 14.5000 psychological level with a long lower wick last week Thursday. Since then, 14.5000 has been maintained as short-term support with diagonal resistance (black) being tested today. A break above diagonal resistance may spur further upside toward the March 26 swing high at 15.1014. A consolidation around 14.5000 may ensue which may give USD/ZAR bulls a look at a more favorable entry should prices near support once more.
Support levels:
- 14.5000
- 14.3967
Resistance levels:
- 14.6132
- Diagonal resistance
- 15.1014
EUR/ZAR WEEKLY CHART

Chart prepared by Warren Venketas, IG
The Rand has been extremely strong against the Euro through 2021 with several lockdowns and fears of a third wave plaguing many European countries. The longer-term technical outlook indicates some bullish divergence – price action moving in the opposite direction to the Relative Strength Index (RSI) (black).
In addition, a falling wedge pattern (yellow) may be underway which supplements this bullish view as the pattern unfolds. A break above wedge resistance could lead to significant upside.
EUR/ZAR DAILY CHART

Chart prepared by Warren Venketas, IG
The short-term view shows initial support at 17.1164 which coincides with wedge support. The RSI associates this swing low with an overbought signal which has since pushed higher indicating slowing bearish momentum. The 17.6000 psychological level should serve as initial resistance which has proven a key level of confluence throughout 2021.
Support levels:
- 17.1164
Resistance levels:
- 17.6000
GBP/ZAR WEEKLY CHART
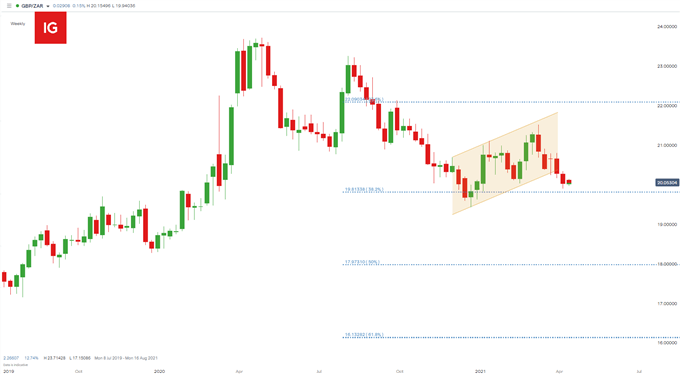
Chart prepared by Warren Venketas, IG
The bear flag on the weekly GBP/ZAR chart has developed in an almost textbook fashion with prices currently hovering around the 20.0000 key horizontal level. This being said, downside may be slowing as the 38.2% Fibonacci support level at 19.8134 holds firm.
GBP/ZAR DAILY CHART

Chart prepared by Warren Venketas, IG
Last week Thursdays low at 19.8962 (now short-term support) may hold for some time should the RSI’s indication of dissipating bearish momentum hold. The March 26 swing high at 20.7917 will provide initial resistance
Support levels:
- 19.8962
- 19.8134
Resistance levels:
- 20.7917
--- Written by Warren Venketas for DailyFX.com
Contact and follow Warren on Twitter: @WVenketas


