


Gold Price Analysis and News
- Gold Forming a Double Bottom?
- US Real Yields Are Still the Best Guide for Gold Direction
- Key Resistance Break Needed to Alter Gold’s Outlook
Gold Forming a Double Bottom?
Perhaps the first bit of encouraging price action in gold in a while, with the precious metal spending little time below $1700 and forming a double bottom at $1670. Although, as I have said on prior occasions, the technical outlook for gold remains somewhat uninspiring until a close above $1760-65 is made. That said, with US yields refraining from pushing higher in recent sessions this has provided gold with some reprieve, but given that US economic data has been printing strong readings, upside risks do remain for US yields.

US Real Yields Are Still the Best Guide for Gold Direction
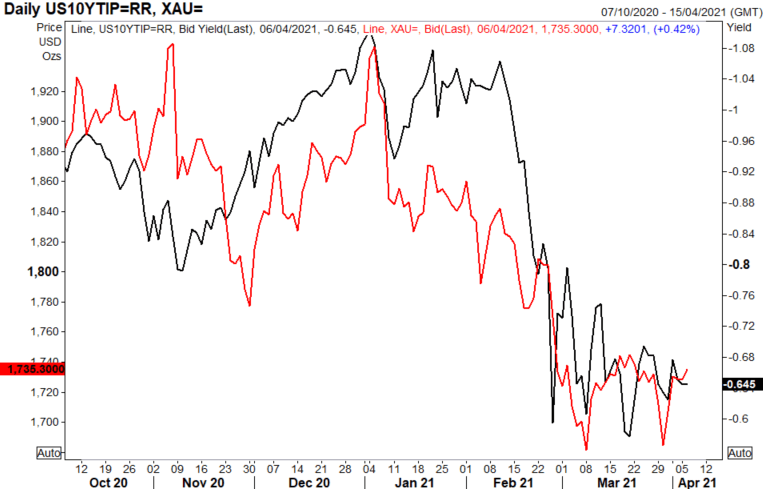
Source: Refinitiv
Key Resistance Break Needed to Alter Gold’s Outlook
Taking a closer look into the technicals, the RSI is hovering around 50, which has thus far held firm. However, a positive sign for gold bulls would be for a firm move above 50 to suggest that the outlook may be brightening up for the precious metal. With that in mind, the main area to focus on is $1760-65, in which a move lower in US yields would be needed to help gold test this resistance. Should this area be broken, this paves the way for a move to 1790-1800. While on the flip side, a close below $1670 would likely invalidate the potential recovery and open the doors to $1600.
Gold Chart: Daily Time Frame
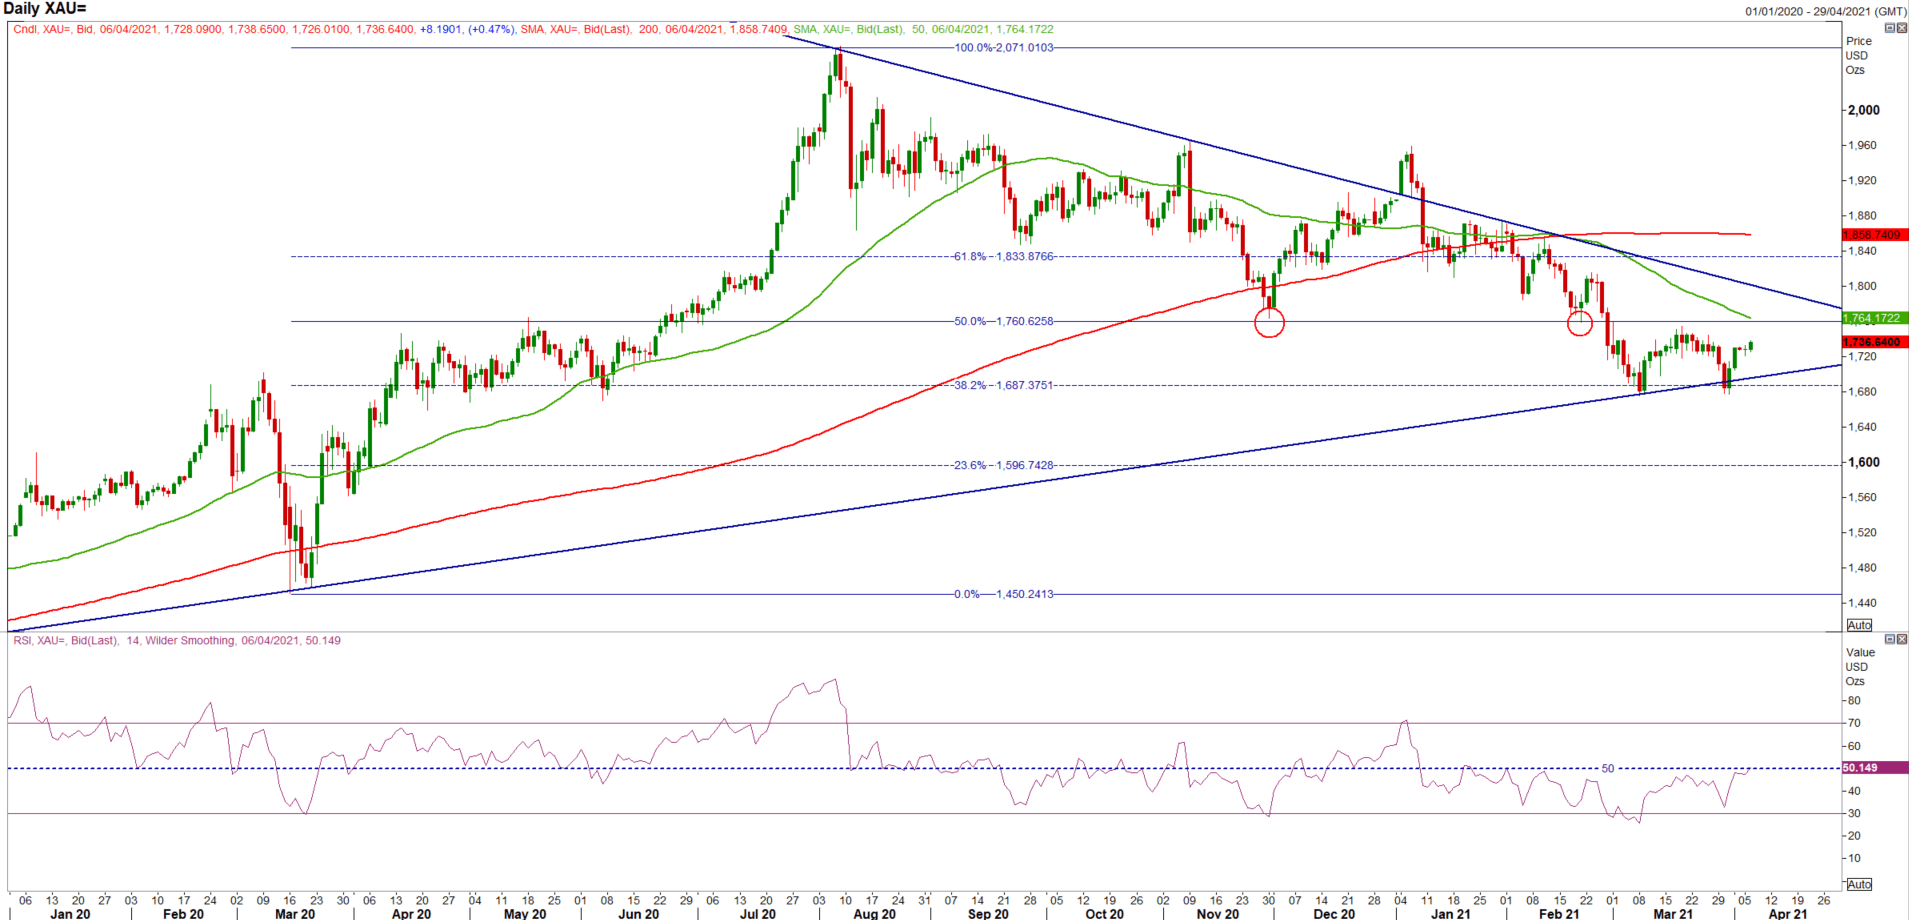
Source: Refinitiv
| Change in | Longs | Shorts | OI |
| Daily | 10% | -8% | 1% |
| Weekly | 19% | -20% | -2% |


