


Bitcoin (BTC/USD) and Ethereum (ETH/USD) Price, Analysis and Chart:

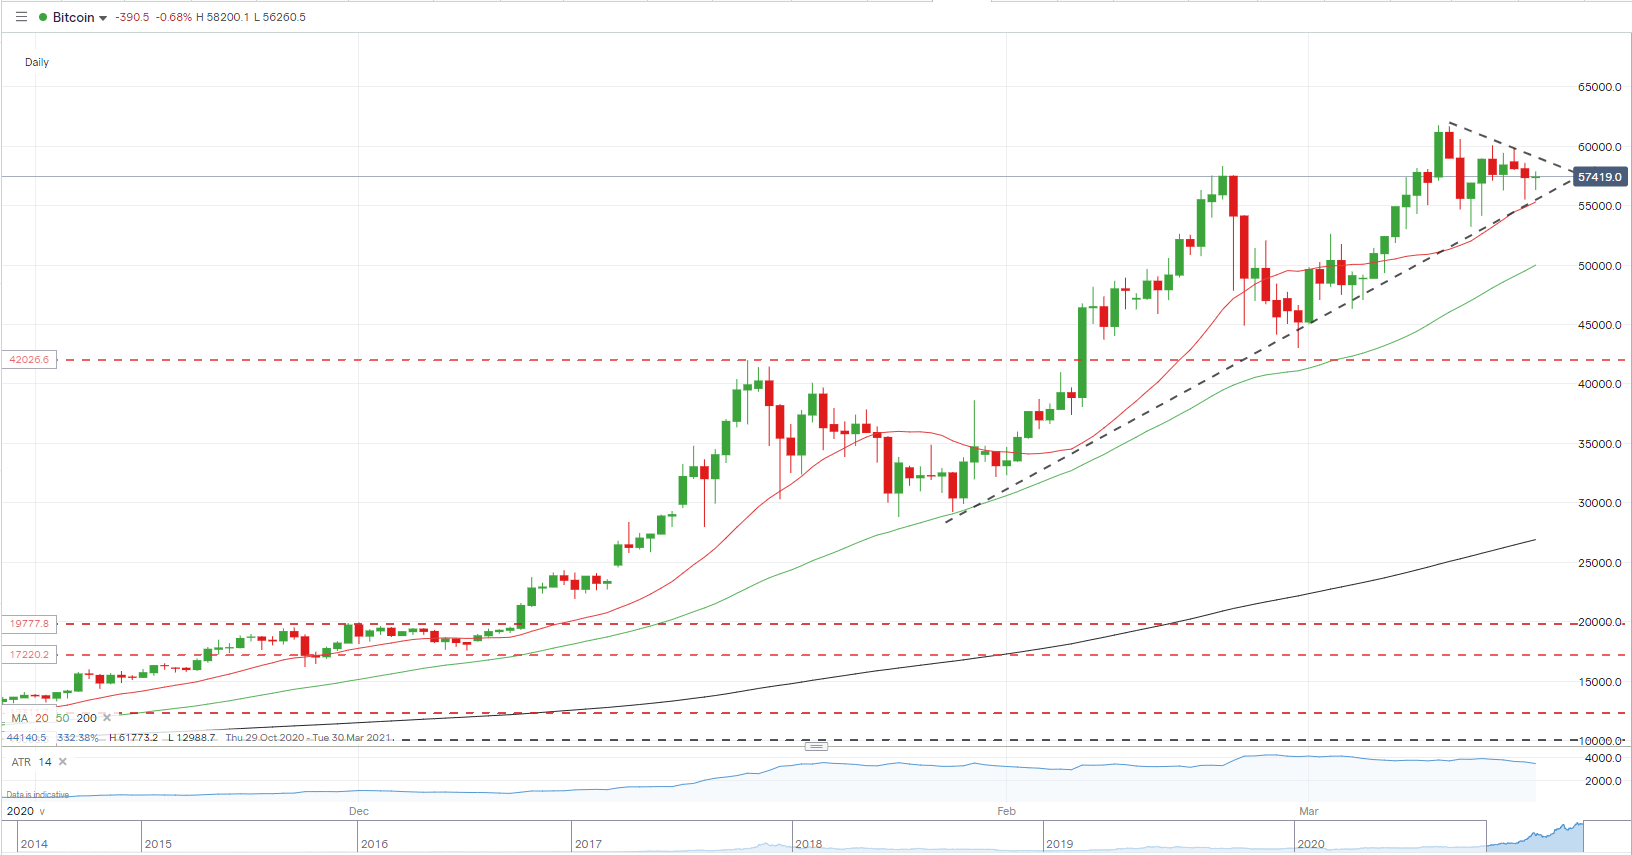
A quiet open to the week for Bitcoin but volatility may soon return as the cryptocurrency becomes trapped between two trendlines. The recent uptrend continues to serve Bitcoin traders well, providing well-flagged areas of support. This trend is now coming under pressure from a short-term bearish resistance trendline off the recent high print, meaning a break of one trend will happen in the near future. This bullish pennant set-up suggests, as the name implies, a topside breakout that would put the recent all-time high under pressure. A clean break and open either above or below trend is needed to confirm the next move.
Pennant Patterns: Trading Bearish & Bullish Pennants
Bitcoin (BTC/USD) Daily Price Chart (September 2020 – March 22, 2021)
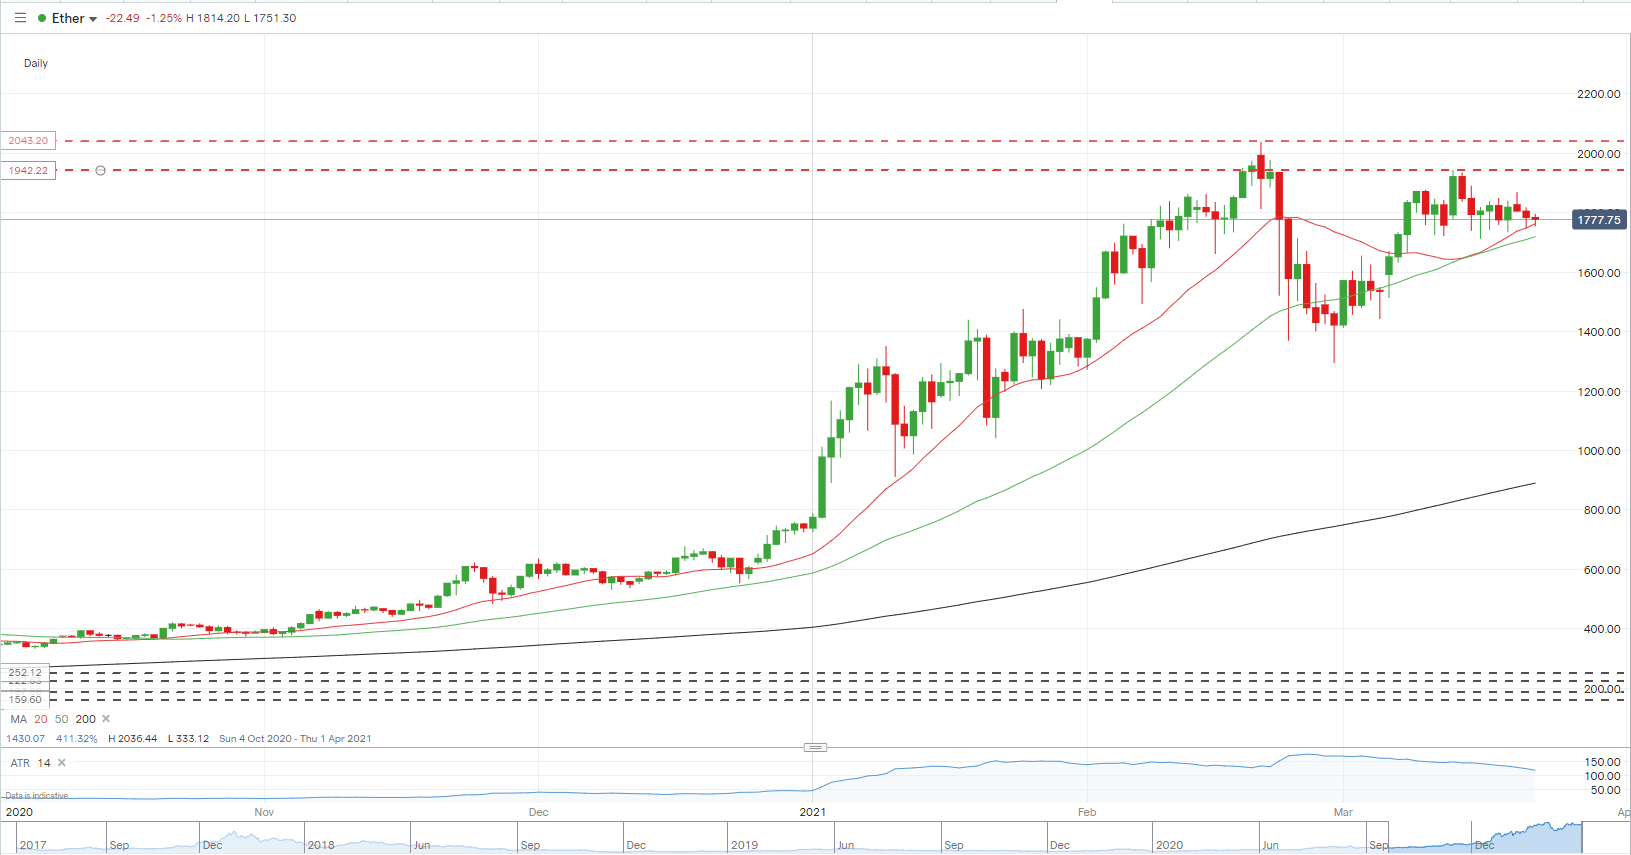
Ethereum, the second-largest cryptocurrency, is struggling to push higher and may find difficulty breaching the $2,000 level again in the near-term. While a cluster of recent lows, and the 20- and 5-day smas, between $1,700 and $1,750 provide reasonable support, the short-term downtrend off the March 13 high at $1,944 may put this support zone under pressure and expose the next level of support around $1,670. ETH/USD remains volatile with a current 14-day ATR reading of around $117, suggesting that any break lower has the room to test the $1,670 level quickly.
Ethereum (ETH/USD) Daily Price Chart (October 2020 – March 22, 2021)
Traders of all levels and abilities will find something to help them make more informed decisions in the new and improved DailyFX Trading Education Centre
What are your views on Bitcoin (BTC) and Ethereum (ETH) – bullish or bearish?? You can let us know via the form at the end of this piece or you can contact the author via Twitter @nickcawley1.


