


Gold price and crude oil prices, news and analysis:
- The price of gold has hit its highest level since March 1 but the more US government bond yields rise the less attractive gold becomes and a setback looks overdue.
- By contrast, the price of US crude oil has been dropping but as forecasts for global economic growth are increased it may well begin to rise on the improved outlook for demand.
Gold price reversal lower likely
For most of March so far the gold price has been rising steadily, increasing from a low of $1,676.89 per ounce on March 8 to current levels not far short of $1,750. Yet that advance is looking increasingly like a modest correction within a major trend lower and the correction could soon be over, leading to more price falls.
The gains in the gold price this month have come despite increases in the yields on US Treasury bonds and notes, which make zero-yielding gold less and less attractive so, in this case, both fundamental and technical factors are pointing in the same direction – to prices heading lower.
Gold Price Chart, Daily Timeframe (November 4, 2020 – March 18, 2021)

Source: IG (You can click on it for a larger image)

By contrast, crude oil prices have been easing back, falling from a high of $67.86 per barrel on March 8 for the US contract to current levels just under $64. Yet that looks like simply a correction lower within a major trend higher that will likely resume soon.
From a fundamental perspective, oil prices have been suffering from news of rising US inventories of the commodity. However, global economic growth forecasts are being revised higher as widespread coronavirus vaccinations increase the chances of a recovery from the slump caused by the pandemic. That should increase demand for oil as increasing output fuels the need for the commodity, raising prices in the process.
US Crude Oil Price Chart, Daily Timeframe (December 7, 2020 – March 18, 2021)
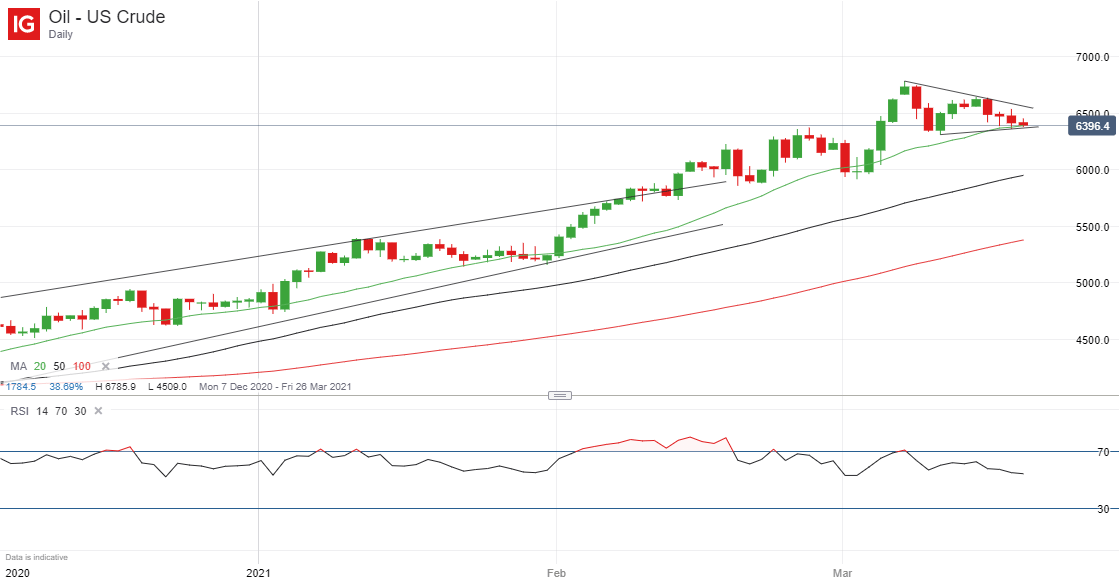
Source: IG (You can click on it for a larger image)

--- Written by Martin Essex, Analyst
Feel free to contact me on Twitter @MartinSEssex


