


Bitcoin (BTC/USD) Price Outlook:
- Bitcoin pushed to new heights over the weekend before retreating to support around $55,000
- While losses have seen Bitcoin forfeit recent gains, the longer-term rally remains intact and consolidation could prove healthy
- S&P 500 Forecast: Fund Flows Reveal Tech, Treasury and Gold Weakness
Bitcoin Price Consolidates After New All-Time High, What Next?
Bitcoin waded into uncharted territory over the weekend after crossing above prior highs and beyond $60,000 for the first time in its history. BTC/USD has since seen its ascent slow as bears take control and push the largest cryptocurrency by market cap down to support around the $55,000 mark. With little to suggest the longer-term rally has reached its end, recent losses might serve as healthy consolidation before the next leg higher.
Bitcoin (BTC/USD) Price Chart: 4 - Hour Time Frame (January 2021 – March 2021)
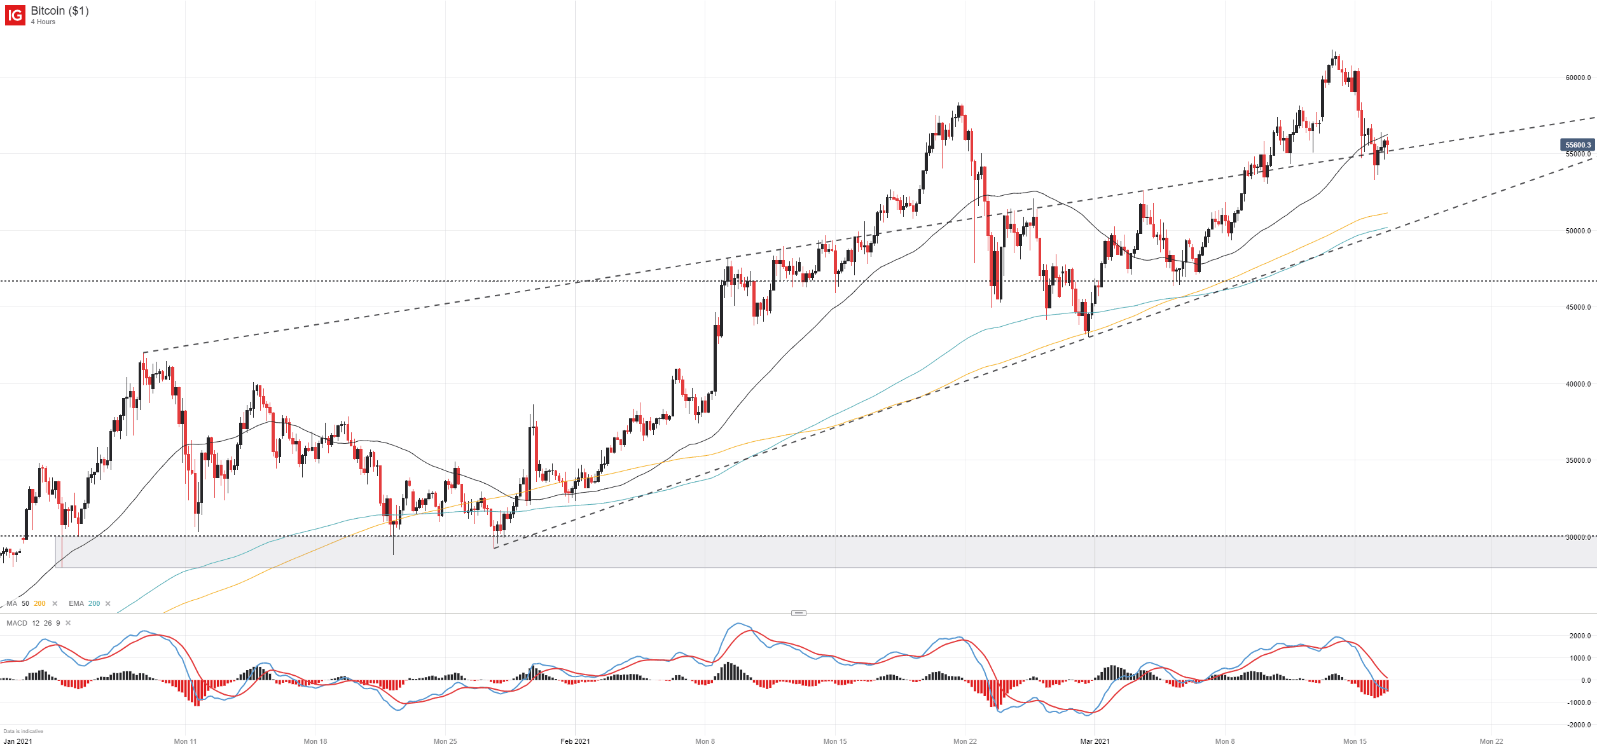
To that end, bulls should eye the rising trendline from the coin’s January high as it looks to provide a modicum of support in the shorter-term. Slightly beneath resides another rising trendline derived from recent swing lows which may provide secondary support should it be required.

A quick glance at the MACD indicator on the 4-hour chart reveals a potential bullish signal as the both the MACD and signal lines cross beneath 0 while price remains above the 200-period exponential moving average. Should the MACD line overtake the signal line while beneath 0, as price trades above the 200EMA, it could signal a continuation higher is ahead. Until such a development occurs, Bitcoin may continue to bleed lower as it seeks support from the various trendlines.
Bitcoin (BTC/USD) Price Chart: 1 - Hour Time Frame (January 2021 – March 2021)
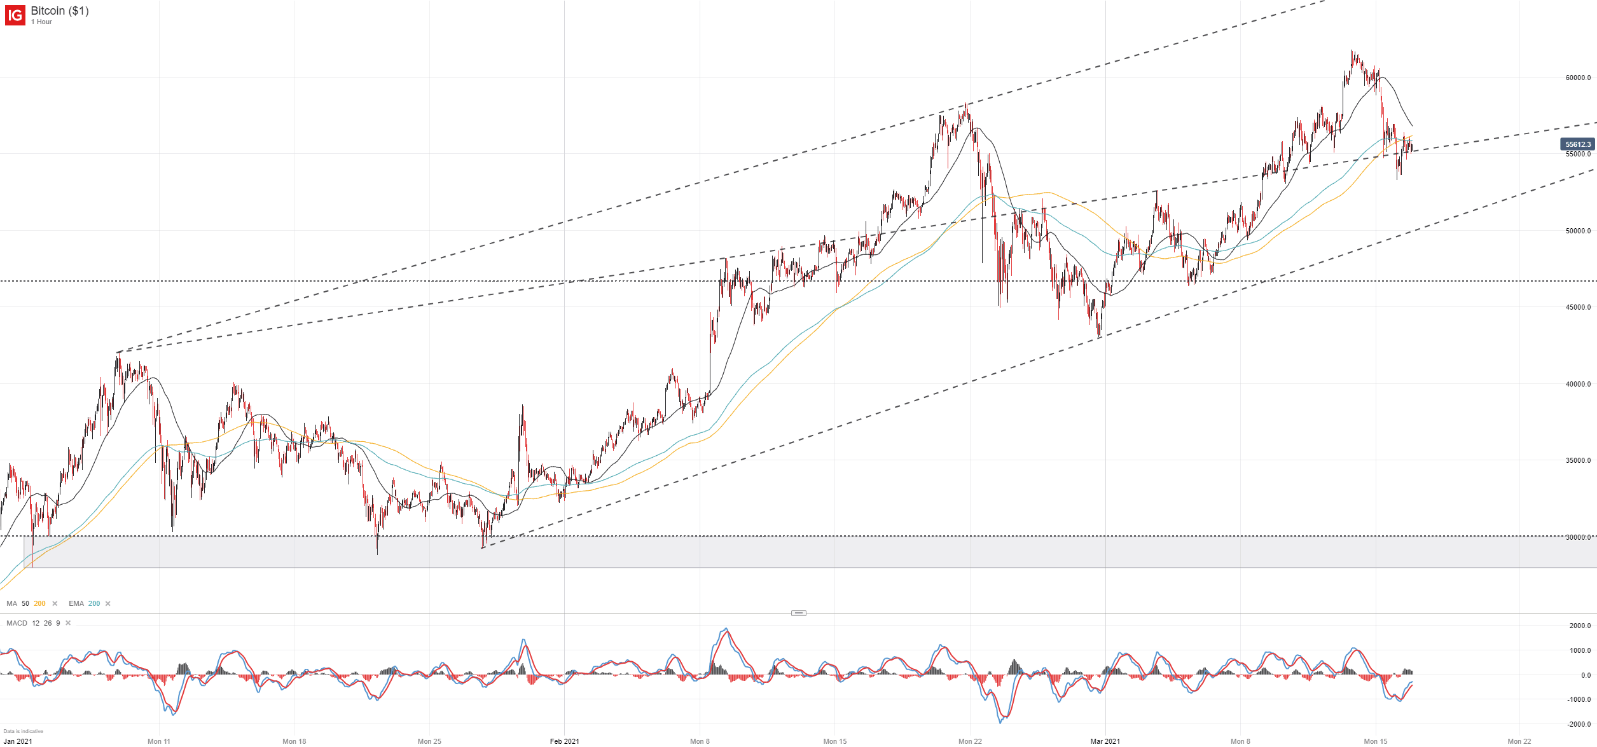
Either way, the technical landscape remains encouraging as recent losses have failed to establish lower-lows and the broader series of higher-highs continues. With continued adoption from some of the largest banks and financial institutions, the tailwinds behind Bitcoin stand firm which could feed into greater gains and new all-time highs in the days to come. In the meantime, keep up to date on recent price developments and analysis using Twitter by following @PeterHanksFX.
--Written by Peter Hanks, Strategist for DailyFX.com
Contact and follow Peter on Twitter @PeterHanksFX


