


EUR/USD, EUR/GBP Price Analysis & News
EUR/USD | A benign inflation report and a somewhat mediocre US 10Y auction has been enough weigh on the greenback and by extension, lift EUR/USD back to the mid-1.19s. This provides the first test of resistance for the countertrend move in the pair and thus today’s close will be key as to whether EUR/USD can push to better levels. Failure to do so and focus will return to a move towards the 200DMA. However, the direction in the Euro will likely be determined by the current moves in US fixed income, which has recently been the key driver behind the gains in the greenback. Looking at the topside technical levels, resistance is ahead at 1.2010-20 with 1.2042 (100DMA) above.
EUR/USD Chart: Daily Time Frame
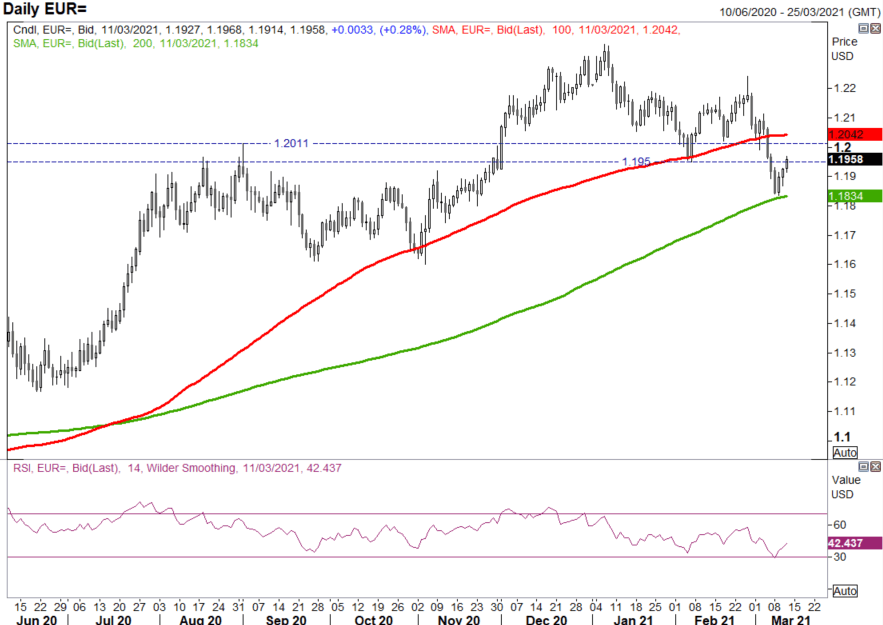
Source: Refinitiv
| Change in | Longs | Shorts | OI |
| Daily | -4% | -4% | -4% |
| Weekly | -12% | 26% | -1% |
EUR/GBP | The sell-off in EUR/GBP has been consistent since the beginning and largely insulated from the recent recovery in the USD. Meanwhile, the narrative over the vaccine trade in the cross has been well documented since January, and arguably this may have played its course already. That said, with the 20DMA continuing to cap any bounces in the cross, momentum remains tilted to the downside. The one caution I would add however, is that the RSI is currently in oversold territory and thus chasing lower levels from here are not appealing, the snapback higher on Feb 25th being the most obvious example. In turn, the view here is to fade rallies from 0.8640-60 (20DMA). On the downside, key support resides at the swing low at 0.8540.
EUR/GBP Chart: Daily Time Frame
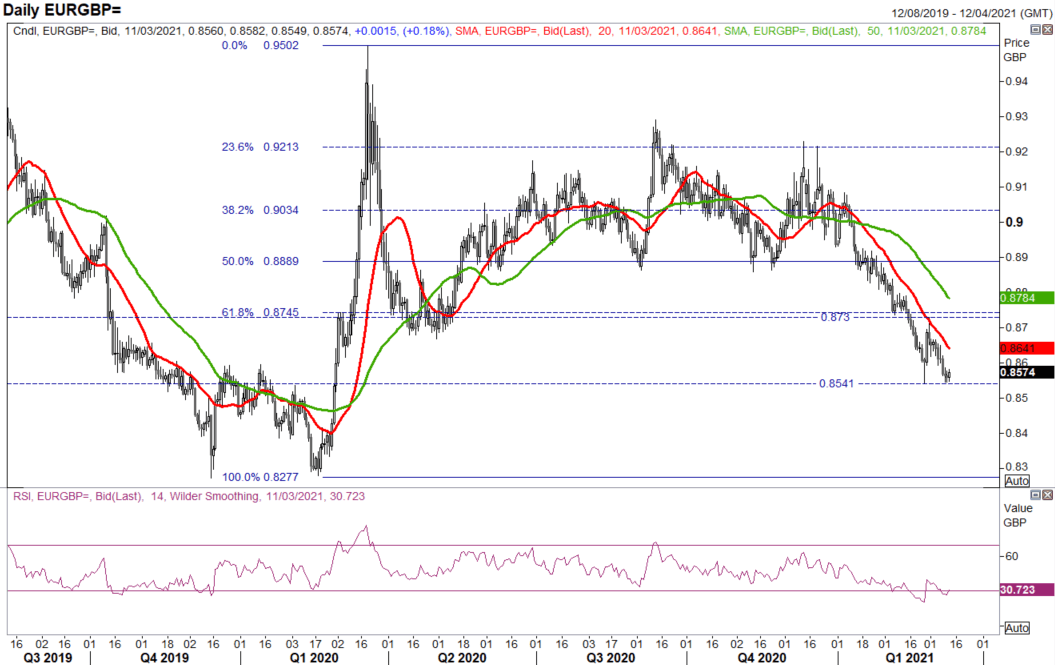
Source: Refinitiv
| Change in | Longs | Shorts | OI |
| Daily | -11% | 6% | -5% |
| Weekly | -22% | 42% | -4% |


