


GBP price, news and analysis:
- GBP/USD has broken higher from a falling wedge pattern on the daily chart.
- That suggests the falls between February 25 and March 8 were corrective and that this week’s gains will likely continue.
GBP/USD technically strong
GBP/USD has broken to the upside from a falling wedge pattern, highlighted in the chart below, suggesting that the losses seen between February 25 and Monday this week were a healthy correction from the prior gains and that the latest move higher should continue.
GBP/USD Price Chart, Daily Timeframe (November 9, 2020 – March 11, 2021)
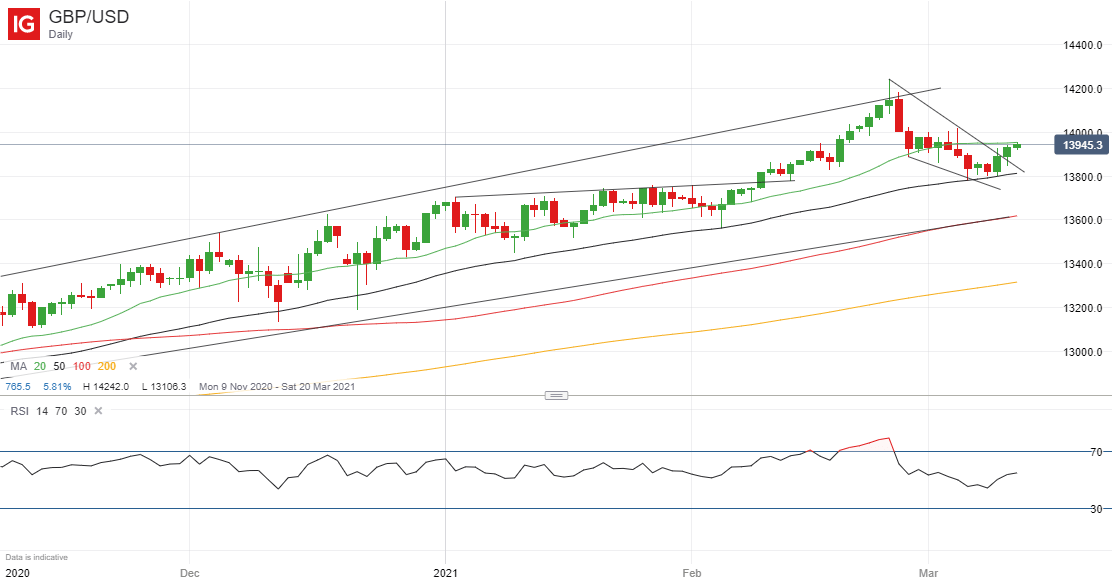
Source: IG (You can click on it for a larger image)
A falling wedge pattern can be either bullish or bearish but in this context the former is more likely, with the February high at 1.4242 the target to the upside once the pair has broken above psychological resistance at 1.40. To the downside, there is trendline support around 1.3840 and then at the 1.3780 low recorded last Friday.
You can find out more about using technical analysis to trade by clicking here

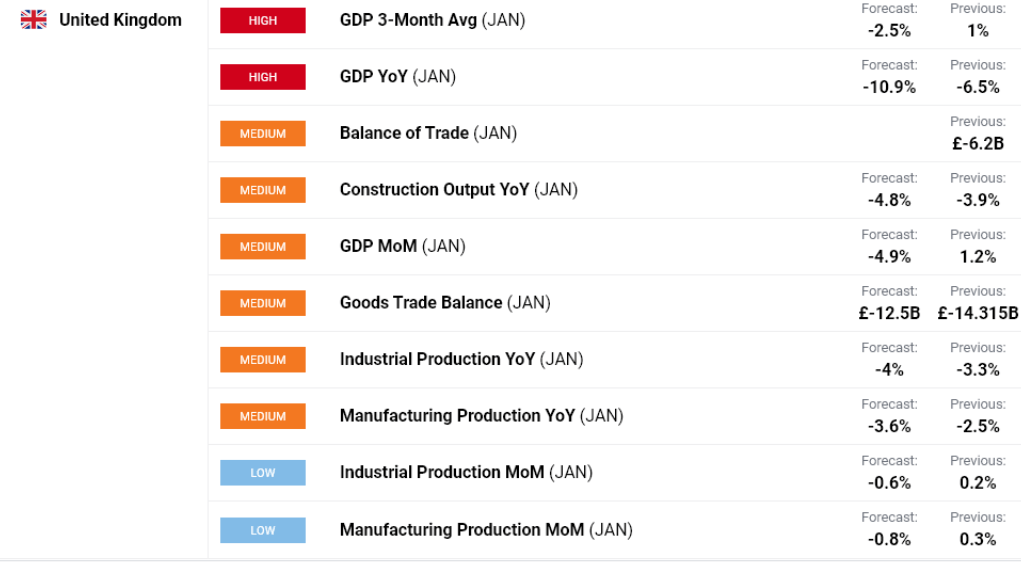
UK GDP ahead
Meanwhile, from a fundamental perspective, the next important batch of figures on the economic calendar is tomorrow’s UK GDP data for January due to be released at 0700 GMT. The consensus forecast based on the expectations of analysts polled by the news agencies is that GDP fell by a jaw-dropping 10.9% year/year. However, the numbers are historic and traders will likely look through them to a later economic bounce-back prompted by the UK’s mass vaccination program.
| Change in | Longs | Shorts | OI |
| Daily | -3% | 4% | -1% |
| Weekly | 3% | 2% | 3% |
--- Written by Martin Essex, Analyst
Feel free to contact me on Twitter @MartinSEssex


