


S&P 500, HANG SENG, ASX 200, ASIA-PACIFIC MARKET OUTLOOK:
- The US Dollar retreated alongside the 10-year Treasury yield after a strong bond auction
- Dow Jones, S&P 500 and Nasdaq 100 indexes climbed 0.10%, 1.42% and 4.03% respectively
- OECD revised up global GDP projections, painting a brighter outlook for post-Covid recovery

Yields, OECD, Pandemic, Asia-Pacific Stocks Outlook:
The yield on 10-year Treasuries fell 7.1bps to 1.528% on Tuesday following a decent note auction. The DXY US Dollar index retreated from a 3-month high of 92.50 to 91.98 as safe haven bids receded, buoying sentiment and setting a positive tone for APAC markets at open. Equity futures across Japan, Australia and Hong Kong are pointing to a strong start. Chinese mainland stocks will be closely watched after news crosses the wires that state-owned funds will step in to shore up the markets.
Rotation from growth to value appeared to have reversed course in the US market, with the technology sector largely outperforming cyclically-oriented names such as energy and financials. The Nasdaq 100 index gained over 4%, led by Tesla (+19.64%). Investors are probably buying the dips after the recent selloff in technology stocks brought prices to more affordable levels. The fundamental outlook seems to be improving, in view of a stronger recovery outlook as well as an impending injection of US$ 1.9 trillion stimulus into the economy. Bitcoin prices resurged to above US$ 54k, approaching a record high.
The OECD has revised up global GDP growth forecast for 2021 to 5.6% from 4.2%, saying that “prospects have improved over recent months with signs of a rebound in goods trade and industrial production becoming clear by the end of 2020”. Vaccine rollouts and government stimulus are likely to provide a major boost to economic activity. With a global economic recovery in sight, the reflation trade may continue to gain traction among investors.
Globally, more than 305 million people have received at least 1 shot of a Covid-19 vaccine, while the 7-day average of new daily cases has fallen to nearly half of the peak seen in mid-January. Nonetheless, the distribution of vaccines remains uneven across the globe, and the pace of economic recovery will largely depend on the race between vaccines and emerging variants of the virus.
US 10-Year Treasury Yield

Chart by TradingView
Australia’s ASX 200 index started modestly higher, led by information technology (+4.66%), healthcare (+1.64%) and consumer staples (+1.18%) sectors, whereas energy (-1.67%), materials (-1.15%) and financials (-0.26%) lagged.
Hong Kong’s Hang Seng Index (HSI) had a volatile trading session on Tuesday, closing 0.81% higher despite continuous outflow via stock connections. Exchange data shows that southbound trading registered HK$ 8.86 billion of net outflows on March 9th, after seeing HK$ 13.18 billion of net outflow in the prior day. Southbound trades contribute to nearly 30% of the entire turnover in the Hong Kong stock exchange, therefore it can be viewed as a reliable sentiment barometer. Large capital outflows via the HK-Shenzhen and HK-Shanghai link suggests that mainland investors are increasingly wary about rising longer-term yields and lofty valuations of technology stocks.

Source: Bloomberg, DailyFX
On the macro-front, the US February inflation data headline the economic docket alongside the BoC interest rate decision and EIA crude oil inventory data. The US consumer price index figures will be closely eyed by currency traders because signs of inflation overheat may intensify market speculation for Fed tapering and may fuel further strength in the longer-term yields. Remarkable gains in crude oil prices over the last 4 months hint at upward price pressure in the month to come. Find out more from DailyFX calendar.
Looking back to Tuesday, 7 out of 11 S&P 500 sectors ended higher, with 49.1% of the index’s constituents closing in the green. Consumer discretionary (+3.80%), information technology (+3.41%) and utilities (+1.27%) were among the best performing sectors, while energy (-1.91%) and financials (-0.86%) trailed behind.
S&P 500 Sector Performance 10-03-2021

Source: Bloomberg, DailyFX

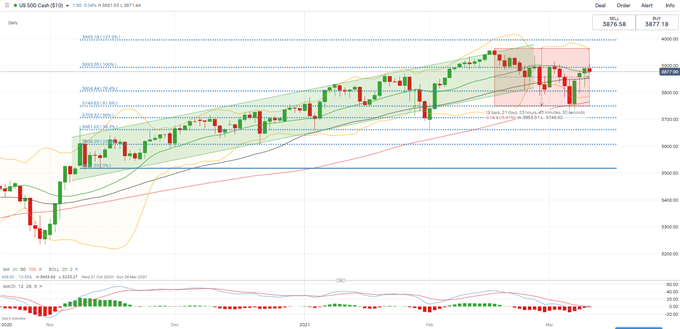
S&P 500 Index Technical Analysis:
Technically, the S&P 500 index rebounded from the 61.8% Fibonacci extension level (3,750) and is now facing an immediate resistance at the 100% Fibonacci extension level (3,893). Breaching it would probably intensify buying pressure and expose the next key resistance of 3,995 (127.2% Fibonacci). The recent selloff appears to be another healthy correction amid a medium-term bull trend, as suggested by the upward-sloped 50- and 100-Day SMAs. The MACD indicator is about to form a bullish crossover, suggesting that near-term momentum may soon turn bullish.
S&P 500 Index – Daily Chart
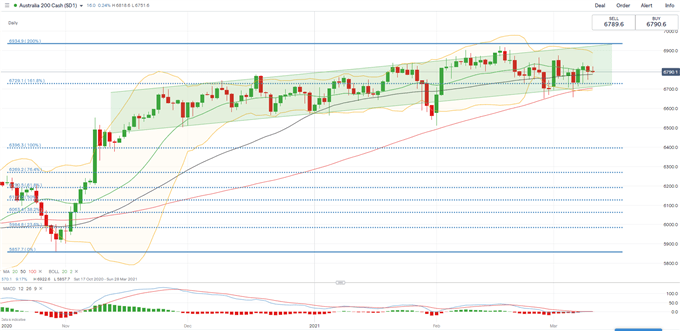
ASX 200 Index Technical Analysis:
The ASX 200 index failed to breach the 200% Fibonacci extension level (6,934) and has since entered a technical correction. A key support level can be found at 6,730 – the 161.8% Fibonacci extension. Prices appear to be consolidating within the “Ascending Channel”, the ceiling and floor of which may serve as immediate support and resistance levels respectively. The MACD indicator is trending lower towards the neutral midpoint, suggesting that near-term momentum remains weak.
ASX 200 Index – Daily Chart
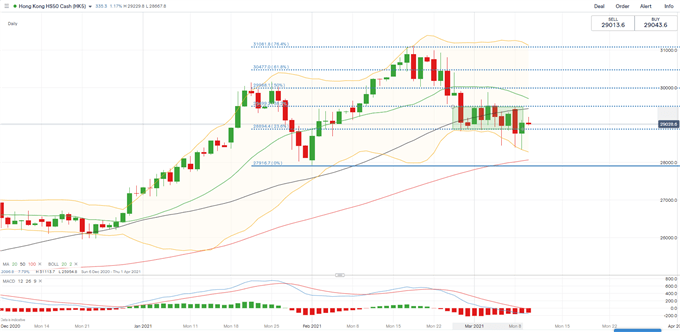
Hang Seng Index Technical Analysis:
The Hang Seng Index hit a strong resistance level at 31,080 (76.4% Fibonacci retracement level) in mid-February and has since entered a consolidative period. Recently, the price was mostly range-bound between 28,900 (23.6% Fibonacci extension) and 29,500 (38.2% Fibonacci extension). A daily close above 29,500 may intensify buying pressure and carve a path for price to challenge the 50% Fibonacci extension level at 29,990. A daily close below 28,900 however, will probably lead to a deeper pullback towards the next support level at 27,916 (previous low).
Hang Seng Index – Daily Chart

--- Written by Margaret Yang, Strategist for DailyFX.com
To contact Margaret, use the Comments section below or @margaretyjy on Twitter


