


Bitcoin, Ethereum, Goldman Sachs, Citigroup, Cryptocurrencies – Talking Points:
- Citigroup and Goldman Sachs recent endorsement of the cryptocurrency market could lead to further upside for Bitcoin and Ethereum.
- BTC/USD poised to move higher after the formation of a Bullish Hammer reversal candle at key support.
- ETH/USD eyeing a retest of the yearly high after bouncing off of 55-EMA support.
Cryptocurrencies have been under fire in recent weeks, with the price of Bitcoin and Ethereum falling 26% and 36% respectively from their yearly highs set in mid-February. However, this may prove to be nothing more than a counter-trend correction, as both digital assets bounce off of key support and accelerate higher.
Moreover, the endorsement of the cryptocurrency market by two major investment banks, Citigroup and Goldman Sachs, could further validate the digital currency market and intensify capital inflows in the near term. Citigroup’s Global Perspectives and Solutions thinktank stated that Bitcoin could become “the currency of choice for international trade”, while Goldman plans to offer Bitcoin futures by the middle of this month.
This comes on the back of Bank of New York Mellon’s statement that it would treat BTC the same as any other financial asset and Mastercard’s commitment to integrate Bitcoin into its payment network. Tesla also announced a $1.5 billion investment in Bitcoin and plans to begin accepting it as a form of payment. These developments will probably underpin both Bitcoin and Ethereum in the coming weeks and may even result in resumption of the primary uptrends extending from the March 2020 nadirs. Here are the key levels to watch for BTC/USD and ETH/USD.
Bitcoin Daily Chart – Bullish Hammer Hints at Key Reversal
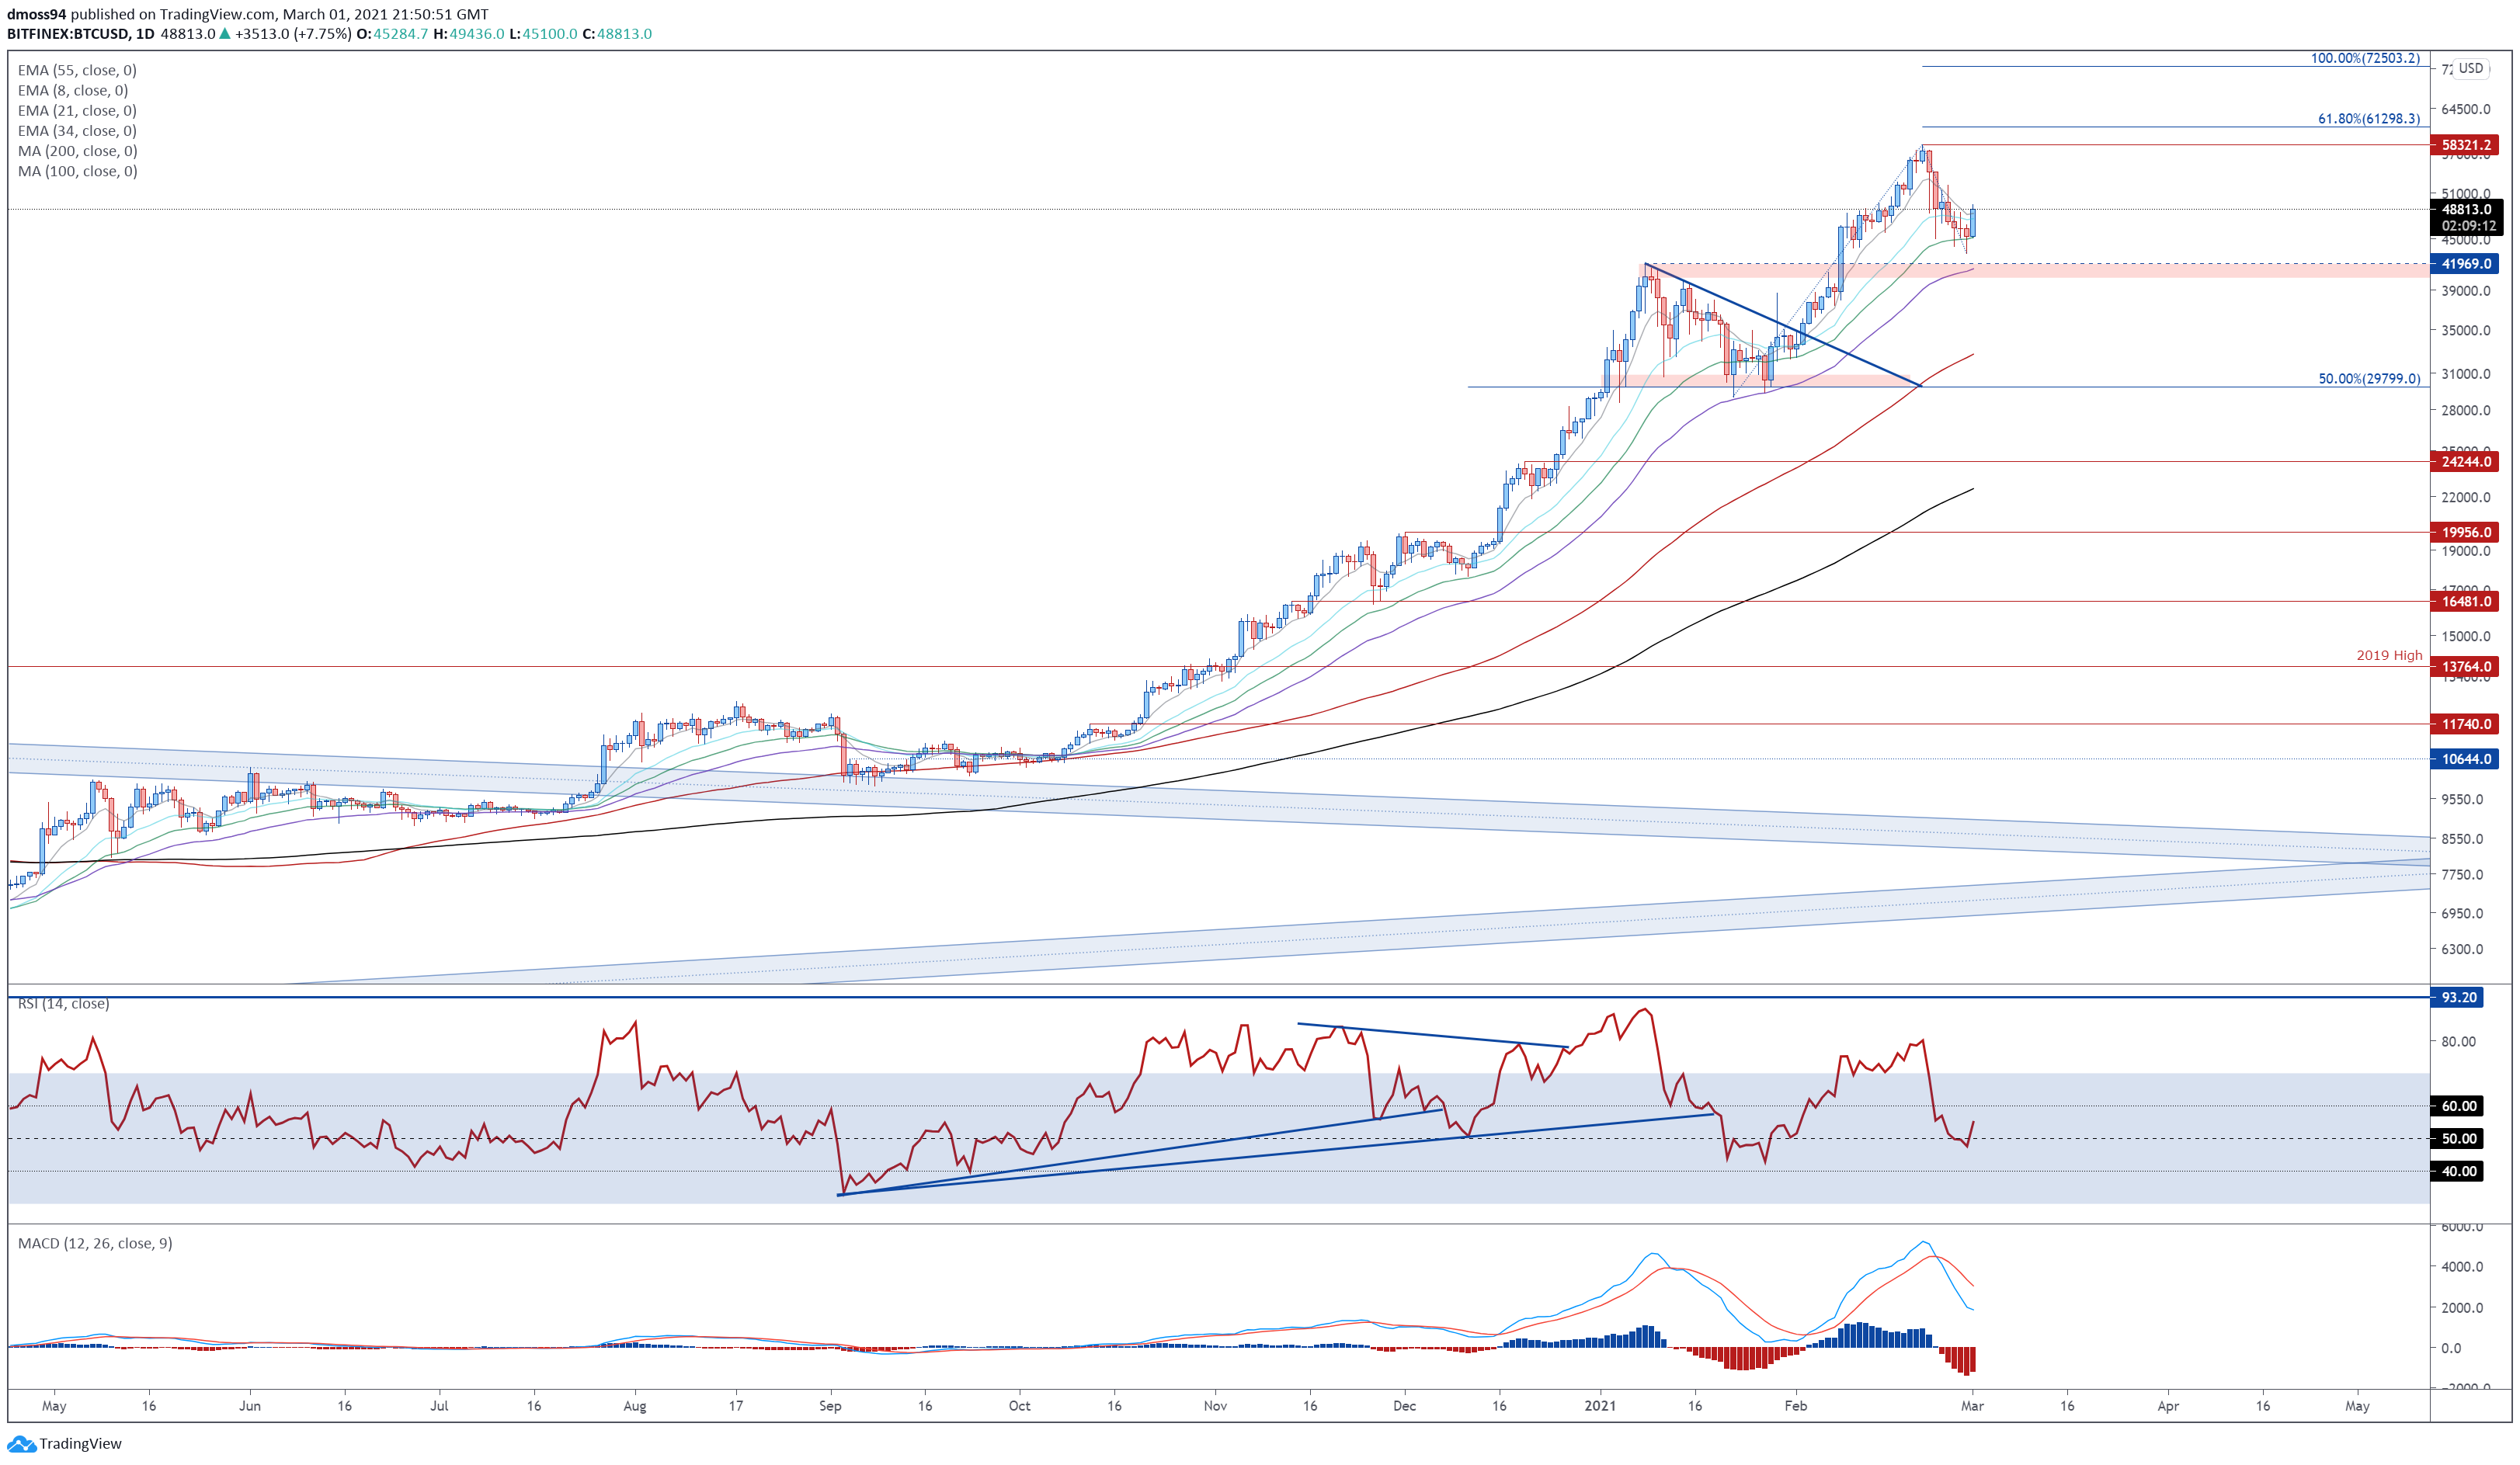
Bitcoin daily chart created using Tradingview
The formation of a bullish Hammer reversal candle at the 34-EMA (45176), followed by a Bullish Engulfing candle as validation, suggests that Bitcoin’s 7-day correction lower could be at an end.
With the RSI bursting back above 50, and the MACD tracking firmly above its neutral midpoint, the path of least resistance seems skewed to topside.
A daily close back above psychological resistance at 50,000 would probably intensify near-term buying pressure and generate an impulsive push to retest the yearly high (58,321). Hurdling that brings the 61.8% Fibonacci (61298) and 65,000 mark into the crosshairs.
However, if 50,000 holds firm, a more extended pullback to former resistance-turned-support at the January high (41969) could be on the cards.
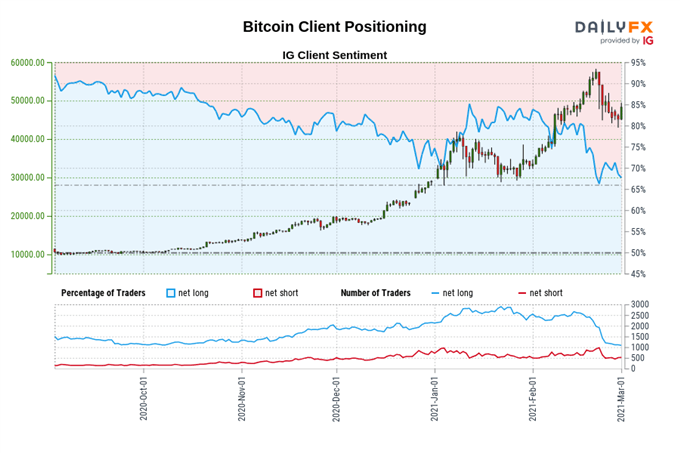
The IG Client Sentiment Report shows 69.56% of traders are net-long with the ratio of traders long to short at 2.28 to 1. The number of traders net-long is 0.46% lower than yesterday and 25.31% lower from last week, while the number of traders net-short is 12.22% lower than yesterday and 28.40% lower from last week.
We typically take a contrarian view to crowd sentiment, and the fact traders are net-long suggests Bitcoin prices may continue to fall.
Traders are further net-long than yesterday and last week, and the combination of current sentiment and recent changes gives us a stronger Bitcoin-bearish contrarian trading bias.
Ethereum Daily Chart – Range Support to Trigger Bullish Reversal
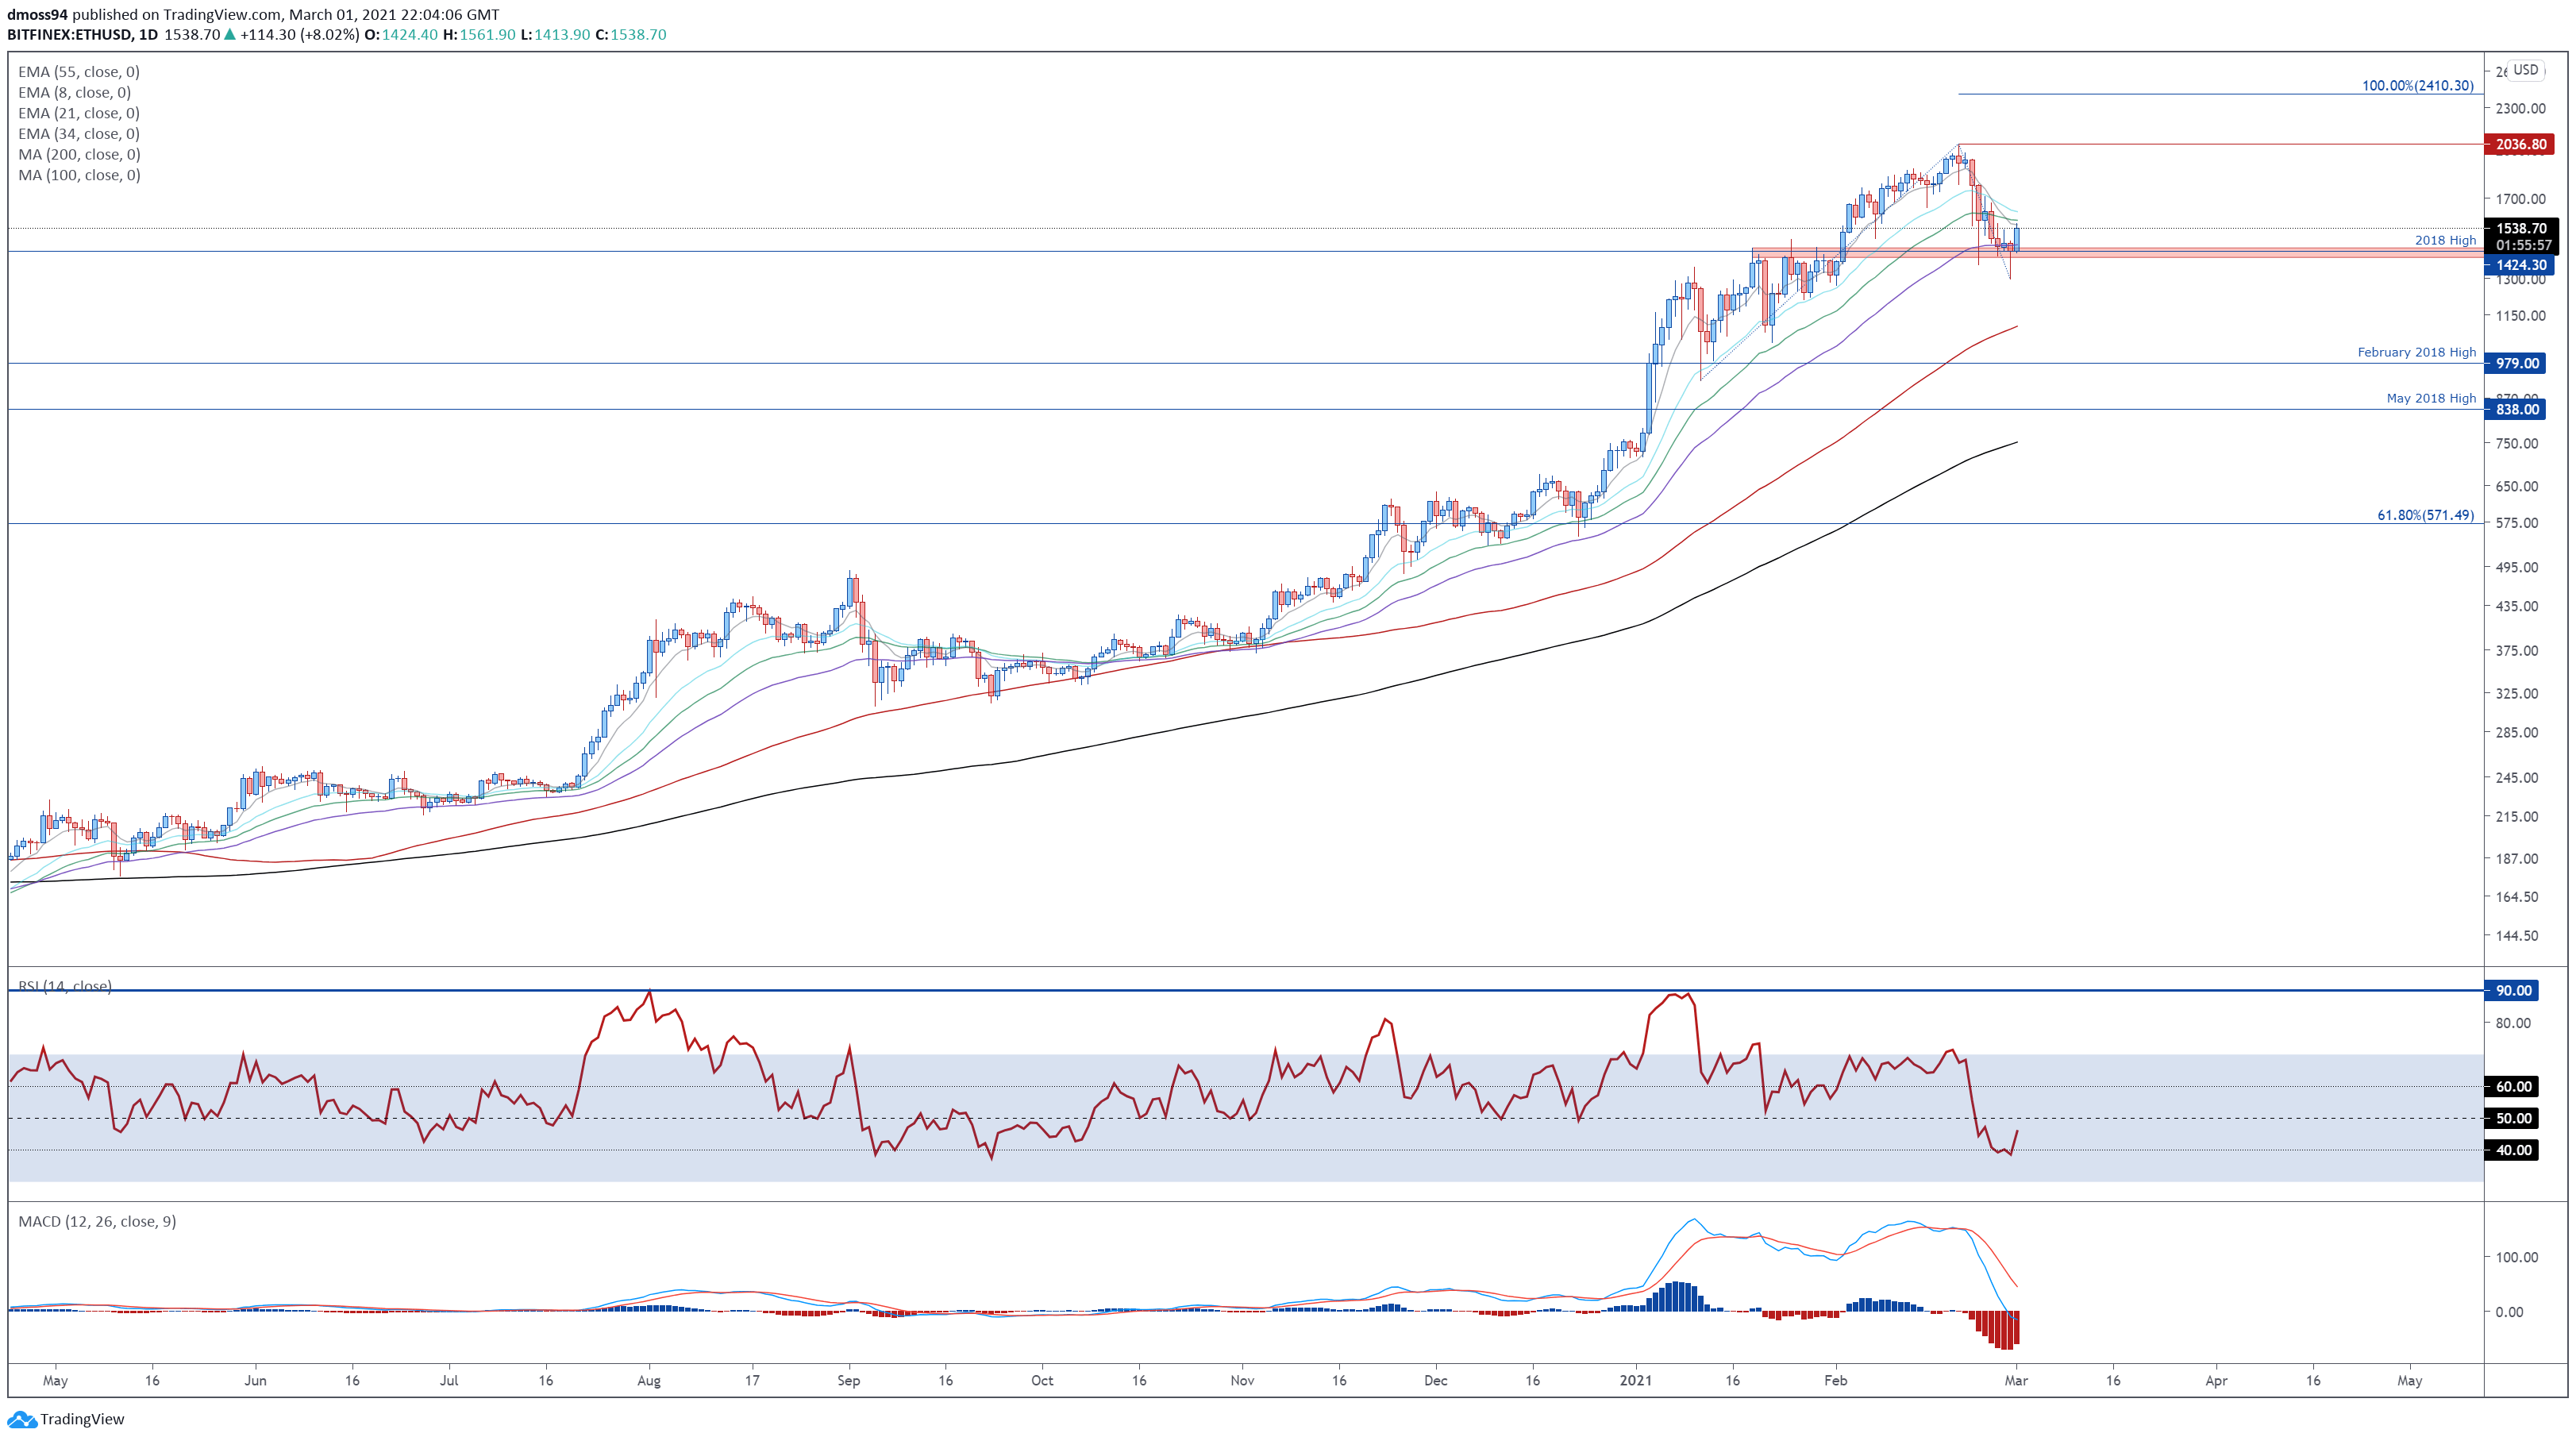
Ethereum daily chart created using Tradingview
Ethereum also looks set to climb higher in the coming days, as prices surge away from confluent support at the trend-defining 55-EMA and 2018 high (1424).
Gaining a firm foothold back above psychological resistance at 1600 would likely pave the way for buyers to retest the yearly high (2036). A daily close above is ultimately needed to signal the resumption of the primary uptrend and bring the 100% Fibonacci (2410) into focus.
Alternatively, a daily close below range support at 1400 – 1440 could encourage would-be sellers and result in a pullback to mobile support at the 100-MA (1108).
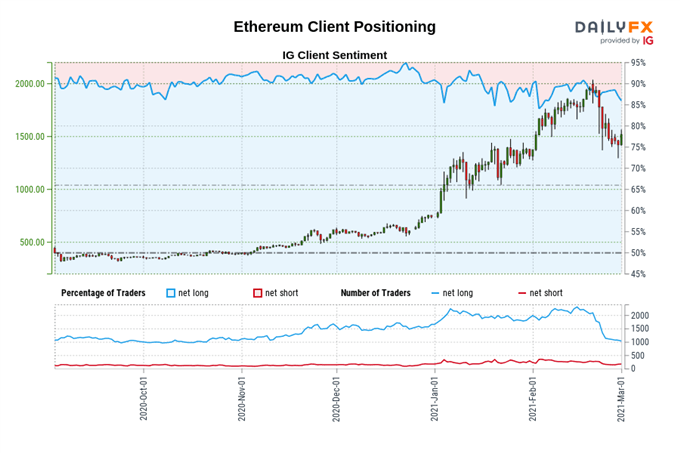
The IG Client Sentiment Report shows 86.84% of traders are net-long with the ratio of traders long to short at 6.60 to 1. The number of traders net-long is 0.39% lower than yesterday and 24.39% lower from last week, while the number of traders net-short is 16.22% lower than yesterday and 21.72% lower from last week.
We typically take a contrarian view to crowd sentiment, and the fact traders are net-long suggests Ethereum prices may continue to fall.
Positioning is more net-long than yesterday but less net-long from last week. The combination of current sentiment and recent changes gives us a further mixed Ethereum trading bias.
-- Written by Daniel Moss, Analyst for DailyFX
Follow me on Twitter @DanielGMoss


