


Gold (XAU/USD) Analysis, Price and Chart
- US bond yields are weighing on the precious metal.
- Horizontal support is under pressure and looks increasingly fragile.

Gold printed a fresh eight-month low earlier in today’s session and the precious metal looks set to fall further if US Treasury yields resume their multi-month rally. The yield on the benchmark 10-year UST spiked to a session high of 1.61% yesterday, before sliding back to trade on either side of 1.50% after the latest UST 7-year auction revealed very weak demand. US Treasury yields have been on the rise over the last few months as investors increasingly price-in higher growth and inflation expectations down the line. Higher Treasury yields make gold less attractive as an asset class, while the current uptick in the value of the US dollar, buoyed by higher UST yields, also weighs down on the precious metal.
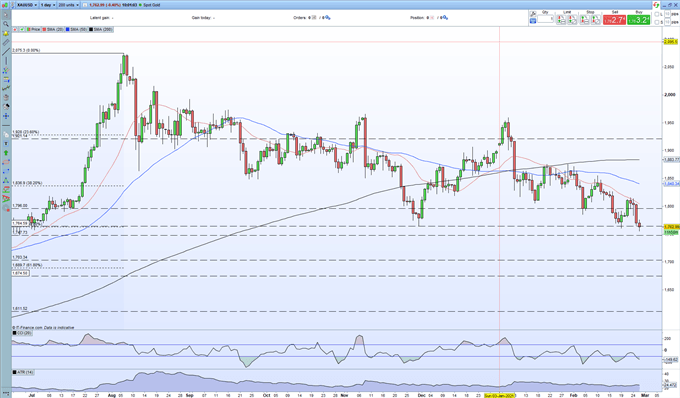
Looking at the daily chart, prior horizontal support around $1,764/oz. is being tested again and a break and open below this level will signal further weakness in XAU/USD. Below here, an old area of prior resistance turned support around $1,743/oz. may prove temporary support ahead of $1,700/oz big figure support ahead of the 61.8% Fibonacci retracement at $1,689.7/oz. The CCI indicator shows the market just moving into oversold territory, but not excessively, while volatility remains fairly constant around $24.5 using the 14-day ATR.
Gold Daily Price Chart (June 2020 – February 26, 2021)
| Change in | Longs | Shorts | OI |
| Daily | -2% | -4% | -3% |
| Weekly | -2% | -8% | -5% |
Client sentiment shows 86.57% of traders are net-long with the ratio of traders long to short at 6.45 to 1.We typically take a contrarian view to crowd sentiment, and the fact traders are net-long suggests Gold prices may continue to fall.Positioning is more net-long than yesterday but less net-long from last week. The combination of current sentiment and recent changes gives us a further mixed Gold trading bias.
What is Market Sentiment and How Does it Work?
What is your view on Gold – are you bullish or bearish?? You can let us know via the form at the end of this piece or you can contact the author via Twitter @nickcawley1.


