


Key Talking Points:
- Boris Johnson’s 4-stage plan to reduce social distancing measures puts optimism in UK assets
- UK stocks struggle to find buyer support as GILTS are making equities look expensive
- The FTSE 100 has once again reverted to its mean within the Bollinger Bands pattern

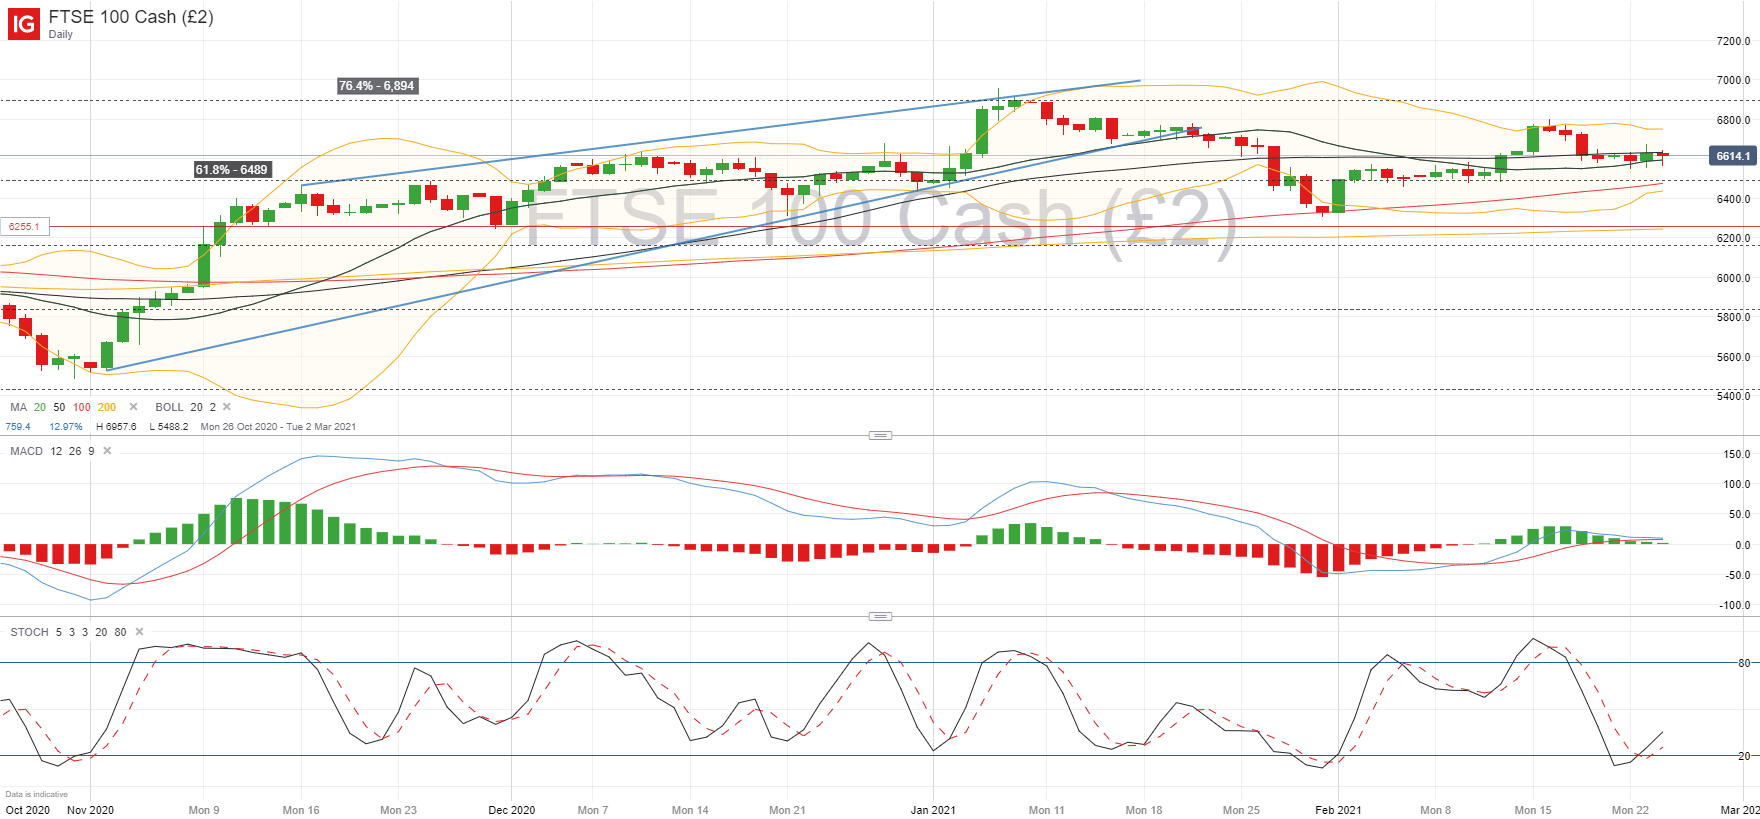
The FTSE 100 has come back a touch from the last time I wrote about it last week, falling from the upper bound of the Bollinger range back to its mean-reversion level at the center of the range. I mentioned this last week, focusing back then on 61.8% Fibonacci at 6,489, with a shift higher in the range meaning the focus is now around the 6,560 level, where support has been found in the last few sessions.
FTSE 100 Daily chart
The optimism around a stern plan of action towards lifting the social distancing measures imposed in the UK to curb the spread of Covid-19 is likely to be a key factor supporting the FTSE 100 going forward, seeing as how the UK index was the main outperformer yesterday in Europe. But significant headwinds remain for the FTSE, which is still trying to fill the gap from the falls seen last March, a significant disadvantage to most of its European peers, held back mostly by the uncertainty surrounding Brexit until the end of 2020.
Technically, the index has struggled to break higher from key Fibonacci levels, with current price still lingering around the 61.8% retracement level despite first attempting to break it back in June 2020, followed by a move above in December. Since then, the FTSE 100 has fluctuated on either side of it, with a push higher at the beginning of December being rejected at the next Fibonacci level (76.4% at 6,894), and coming right back down to the 61.8% area again.
If you’re looking for a bullish signal to enter the market, there isn’t much of one yet other than strong support at its mean-reverting level, although yesterday’s indecisive candlestick does put a dent in the bearish case. The consensus is that further upside is still achievable, but concerns about rising bond yields – also in the UK, as gilts are shaping up to offer better returns than stocks – could see price fall before economic reopening optimism fully gets its grip on the FTSE 100.
IF further bearish pressure appears, 6,489 – 6,460 is the key area I will be looking at to test buyer support, with a subsequent fall below 6,400 as a key selling signal in the short-term. Alternatively, a break above the Bollinger band range is likely to see resistance at the 6,800 horizontal line, whilst a push above this area could see bullish pressure return to the FTSE 100, with a stern focus on breaking above the 76.4% Fibonacci at 6,894.
| Change in | Longs | Shorts | OI |
| Daily | 25% | -12% | -6% |
| Weekly | -26% | 40% | 18% |
Learn more about the stock market basics here or download our free trading guides.
--- Written by Daniela Sabin Hathorn, Market Analyst
Follow Daniela on Twitter @HathornSabin


